
Transformations of Exponential Functions: Dynamic Visualization and Intersection
Loading the math board and drawing, please wait…
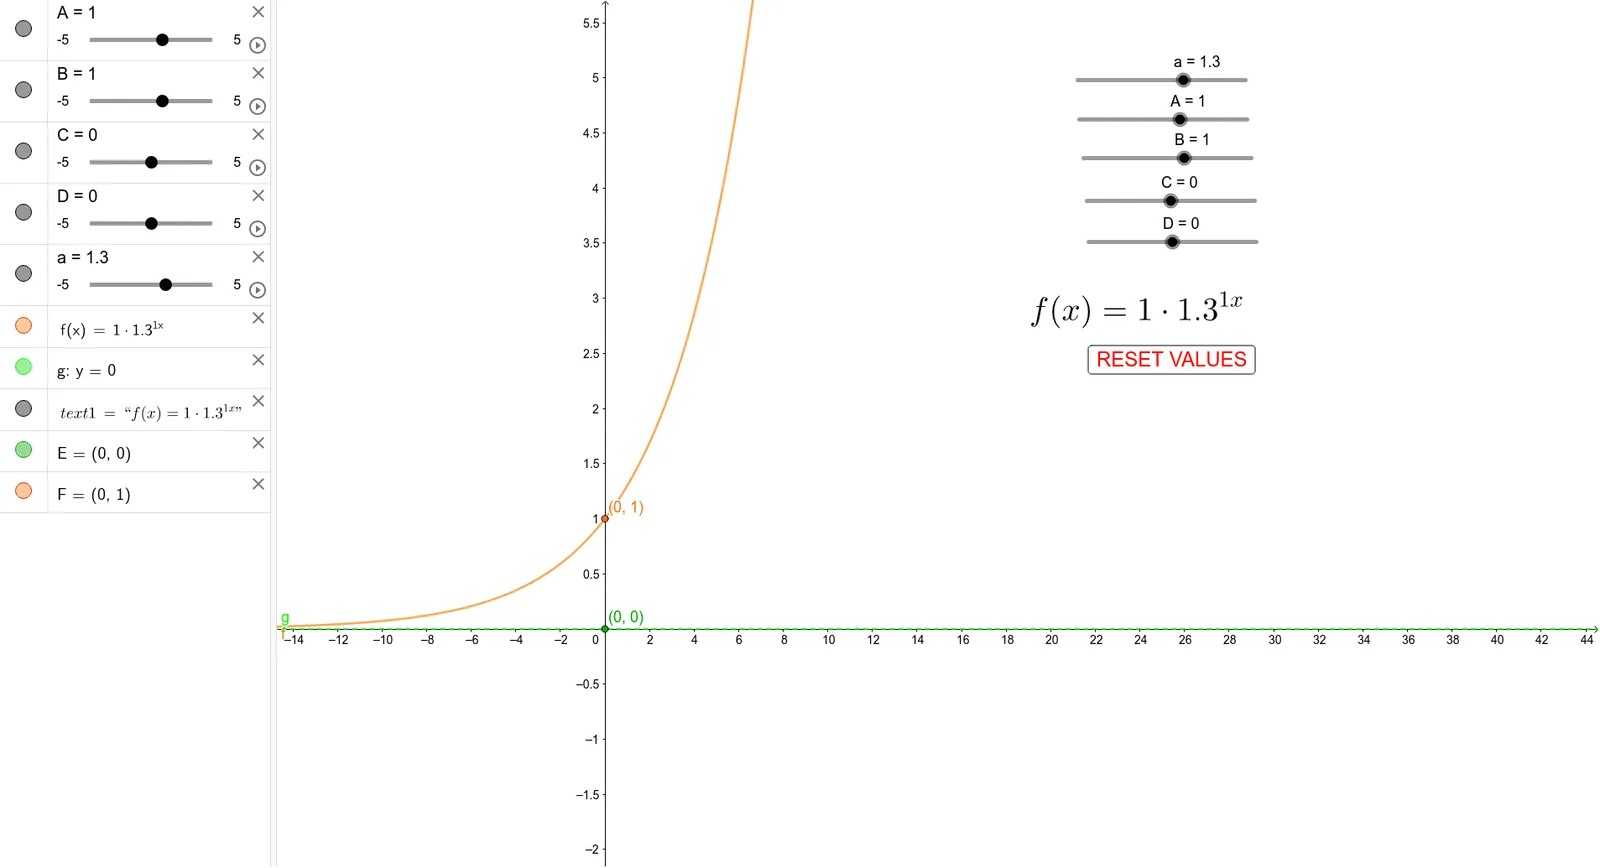
This GeoGebra example dynamically visualizes how exponential functions change under transformations such as translation and scaling, and uses intersection tools to explore the positions of intersection points between the transformed graph and reference lines or axes. The core mathematical concepts include the general form of exponential functions, the influence of parameters (base, coefficient, constant term) on the graph, horizontal and vertical shifts, stretches/compressions, and the algebraic-geometric meaning of intersection points. Construction highlights: from the summary, the Intersect command is used to create intersection objects (A, B, C, D, etc.), with functions f and g defined, along with text1 and button1, likely for toggling transformations or displaying dynamic values. This resource is suitable for high school students learning properties of exponential functions, function transformations, and the integration of algebra and geometry. Through sliders or buttons, users can interactively observe how parameter changes affect the graph and intersections, deepening their understanding of transformation rules for exponential functions.
GeoGebra Commands & Parameters
Intersect(yAxis, g) → EIntersect(f, yAxis, (0, 1)) → F
AI Drawing Prompt Reference
Draw the graph of the exponential function f(x) = a^x and the transformed function g(x) = c * a^(k*(x-h)), where a, c, k, and h are adjustable parameters. Use the intersection of the y-axis and g(x) to create point E, and the intersection of f(x) with the y-axis at point (0,1) to create point F. Observe how the graph and intersection points change by adjusting the parameters.
The prompt above was compiled from the original drawing commands and is for reference only.