
Transformations of Basic Sine Graph
Loading the math board and drawing, please wait…
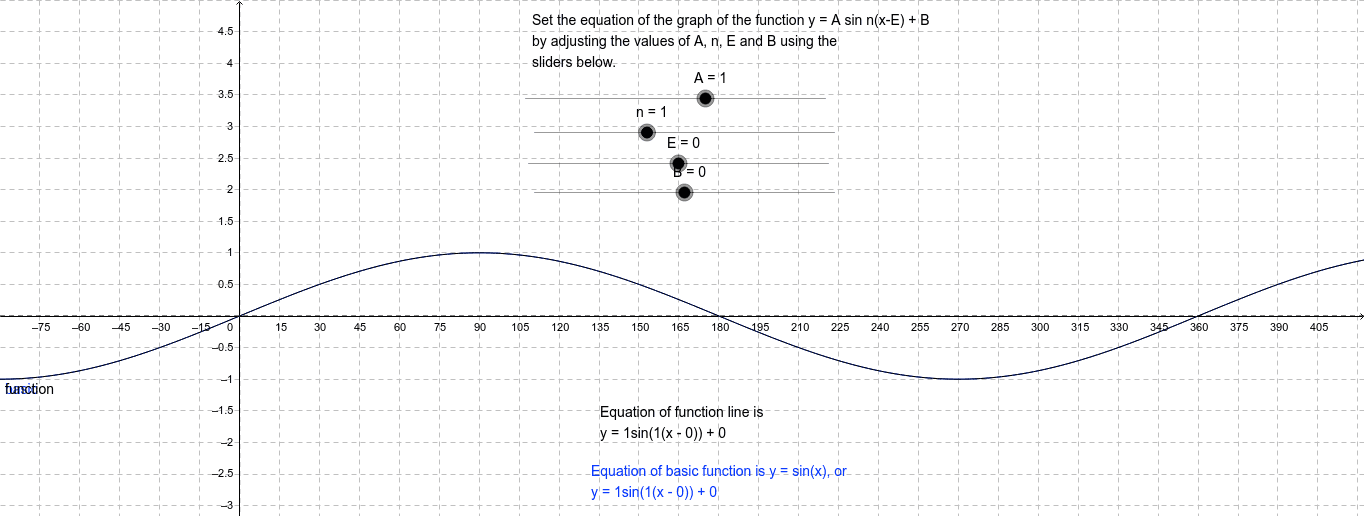
This example demonstrates the effects of changing constants in the general sine function equation on its graph. It covers core math concepts like sine function, function transformations (translation, scaling), and the impact of parameters. Constructed using GeoGebra commands/objects: A (point), n (number), B (number), text1 (text), basic (function), g (graph), text3 (text), E (object), function (function), a (number), text2 (text). Suitable for high school mathematics education to understand the rules of sine function graph transformations.
GeoGebra Commands & Parameters
Numeric A(1.0)Numeric n(1.0)Numeric B(0.0)basic(x) = sin(x * 3.141592653589793 / 180)g(x) = BNumeric E(0.0)function(x) = A * sin(n * 3.141592653589793 / 180 * (x - E)) + Bx = E
AI Drawing Prompt Reference
Draw a basic sine function graph, then observe how the graph changes by adjusting parameters A, n, and B. Start with y=sin(x), then change A to scale the graph, n to translate or stretch it along the x-axis, and B to translate it along the y-axis.
The prompt above was compiled from the original drawing commands and is for reference only.