
Transformation of Sine Graph
Loading the math board and drawing, please wait…
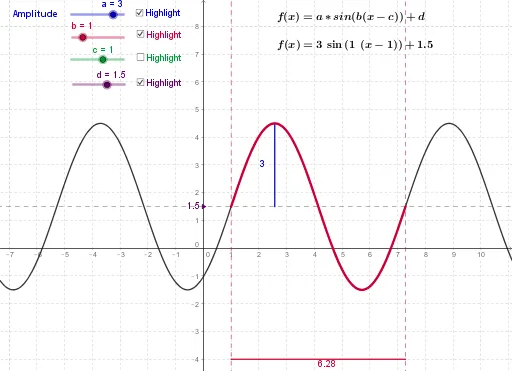
This example demonstrates the transformation effects of sine function graphs, including translations and scalings. Key math concepts involve function graph transformations, amplitude, period, and phase shifts. GeoGebra commands used are Function, Intersect, Segment, Midpoint, with objects like a, b, c, d, f, text1, etc. It is suitable for high school mathematics teaching to understand the rules of trigonometric function graph transformations.
GeoGebra Commands & Parameters
Function(f, c, c + (2 * π / b)) → gIntersect(h, i) → BSegment(A, B) → lSegment(J, K) → kMidpoint(k) → LIntersect(h, t) → MSegment(C, M) → a_1
AI Drawing Prompt Reference
Draw the transformation of a sine function graph, including translations and scalings. First, draw the sine function graph g, then find the intersection point B of two lines, next draw line segments AB and JK, take the midpoint L of JK, then find the intersection point M of another line with t, finally draw line segment CM.
The prompt above was compiled from the original drawing commands and is for reference only.