
Transformation of Sine Function by Gustavo Aguilar
Loading the math board and drawing, please wait…
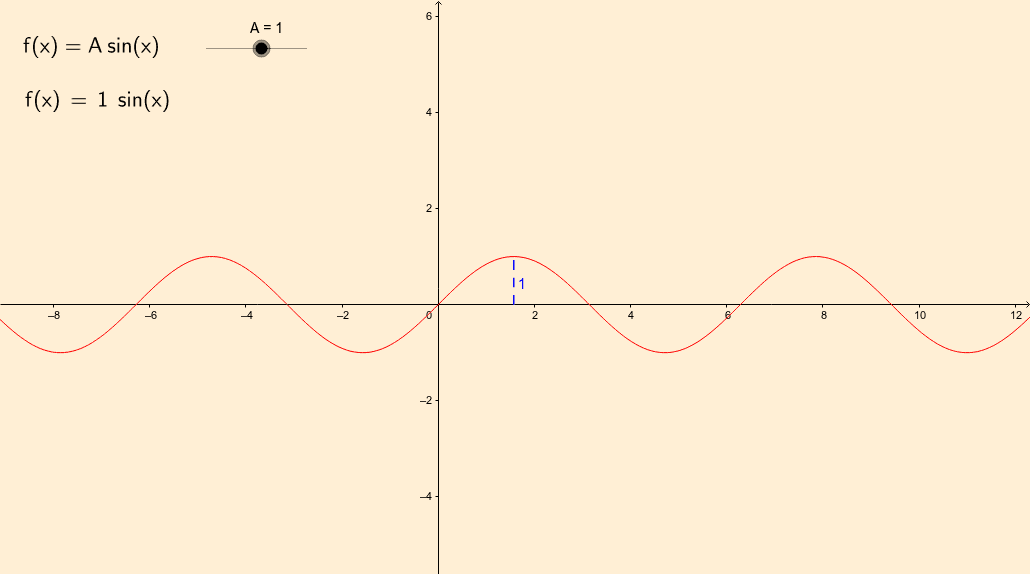
This example demonstrates the effect of amplitude transformation on the sine function graph. Key math concepts include properties of the sine function, amplitude transformation, and analytical geometry. Construction highlights: Utilizes GeoGebra commands like Intersect, Midpoint, OrthogonalLine, Segment, and LaTeX. Suitable for high school mathematics teaching on function transformations, helping students visually understand the impact of amplitude on the sine function graph.
GeoGebra Commands & Parameters
Intersect(f, xAxis, (-1.0247183066273632E-10, 0)) → BIntersect(f, xAxis, (3.1415926484891132, 0)) → CMidpoint(B, C) → DOrthogonalLine(D, xAxis) → aIntersect(f, a, (1.5707963241933207, 1)) → ESegment(D, E) → bLaTeX(f, true, true) → texto1
AI Drawing Prompt Reference
Draw a sine function graph and demonstrate the effect of amplitude transformation. First, find the two intersection points of the sine function with the x-axis, then calculate the midpoint of these two points and draw a line perpendicular to the x-axis from the midpoint. Next, find the intersection point of the sine function with this perpendicular line, and connect the midpoint and this intersection point to form a segment. Finally, label the function expression in LaTeX next to the sine function graph to clearly show the impact of amplitude transformation on the graph.
The prompt above was compiled from the original drawing commands and is for reference only.