
Traffic: Acceleration 5
Loading the math board and drawing, please wait…
In collections
Traffic
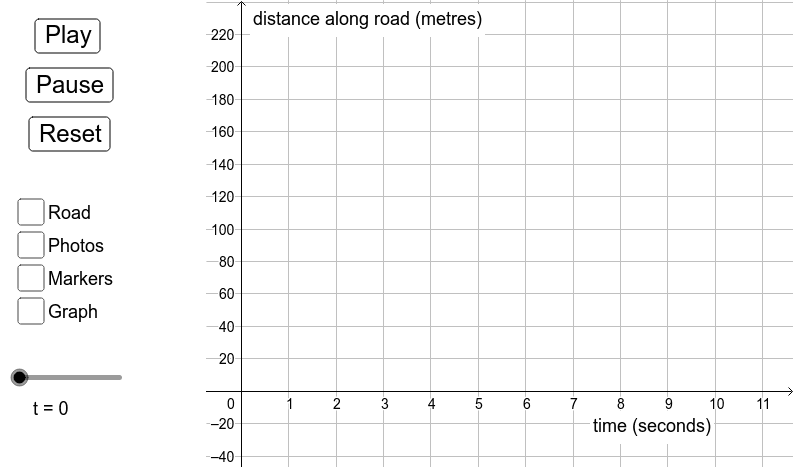
This example demonstrates the function graphs and 3D shapes of acceleration changes in a traffic scenario. Core math concepts include function graphing, solid geometry, continuity, congruence, sequences and series, and quadratic equations. It is constructed using GeoGebra commands like Sequence and Segment, making it suitable for high school students and enthusiasts studying dynamic changes in functions and 3D graphics.
GeoGebra Commands & Parameters
Sequence((n, g(n)), n, 0, t_1) → list2Segment((-1.9, 0), (-1.1, 0)) → road_0Sequence(i - 0.4 < x < i + 0.4, i, 0, t_1) → photo_{road}Sequence(x = i - 0.4, i, 0, t_1) → left_{road}Sequence(x = i + 0.4, i, 0, t_1) → right_{road}Sequence(x = i, i, 0, t_1) → mid_{road}Sequence(Translate[car_p, Vector[(0, g(0)), (i - g_y(i), g(i))]], i, 0, t_1) → photo_rSegment((-1.9, 200), (-1.1, 200)) → road_{200}
AI Drawing Prompt Reference
Draw a function graph and 3D shapes showing acceleration changes in a traffic scenario, featuring a horizontal road and a vertical road of 200 units, with a series of points representing vehicle positions moving along the road and changing over time, forming dynamic trajectories. Include three sequences to indicate the left and right boundaries and the center line of the road, all elements together creating a visualization of a dynamic traffic scene.
The prompt above was compiled from the original drawing commands and is for reference only.