
Tracing Cosine Ratio in a Unit Circle
Loading the math board and drawing, please wait…
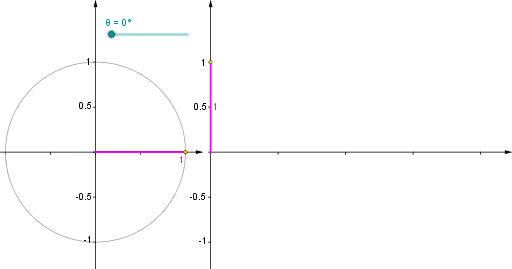
This example demonstrates the dynamic process of tracing the cosine ratio through angle changes in a unit circle. It involves core mathematical concepts such as the unit circle, cosine function, angles, and coordinate geometry. Key GeoGebra commands and objects used include Point, Rotate, Angle, Segment, Circle, Vector, Sequence, and Function, which are essential for constructing the visualization. It is suitable for high school mathematics students to learn and understand the relationship between trigonometric functions and the unit circle, ideal for classroom instruction or self-exploration.
GeoGebra Commands & Parameters
Point(Ray[(0, 0), (-1, 0)]) → BRotate(A, θ, B) → PRotate(A, θ, B) → A'Angle(A, B, A') → αRotate(A, θ, B) → A'_1Angle(A, B, A'_1) → βSegment(Q, (x(Q), 0)) → eSegment((0, 0), (x(Q), 0)) → gCircle(B, A) → cSegment(B, P) → aVector((x(B), y(Corner[1])), (x(B), y(Corner[4]))) → uVector((0, y(Corner[1])), (0, y(Corner[4]))) → wVector((0, 0), (x(Corner[2]), 0)) → zSequence(Segment[((0.75 * i), 0), ((0.75 * i), -0.025)], i, 1, 4) → list1Segment(B, (x(P), 0)) → bSegment(P, (x(P), 0)) → hFunction(cos((120° * x)), 0, x(Q)) → fVector(B - (1.2, 0), B + (1.2, 0)) → vSequence(Segment[(0, (0.5 * i) - 1), (-0.025, (0.5 * i) - 1)], i, 0, 4) → list2Sequence(Segment[(x(B), (0.5 * i) - 1), (x(B) - 0.025, (0.5 * i) - 1)], i, 0, 4) → list3Sequence(Segment[B + ((0.5 * i) - 1, 0), B + ((0.5 * i) - 1, -0.025)], i, 0, 4) → list4Segment(Q, (0, y(Q))) → dPoint(Ray[(0, 0), (-1, 0)]) → B_1Rotate(A_1, θ, B_1) → P_1Rotate(A_1, θ, B_1) → A'_2Rotate(A_1, θ, B_1) → A'_3Circle(B_1, A_1) → c_1Segment(B_1, P_1) → a_1
AI Drawing Prompt Reference
Draw a unit circle and plot a point moving along its circumference. Show the angle between the line connecting the point and the center of the circle and the x-axis, as well as the projection of the point on the x-axis. Also, draw a vector that changes with the angle, showing its angle with the x-axis and projection. Finally, plot the cosine function and connect it to the projection of the point on the unit circle to demonstrate the cosine value's change.
The prompt above was compiled from the original drawing commands and is for reference only.