
TI84 Normal Distribution Practice
Loading the math board and drawing, please wait…
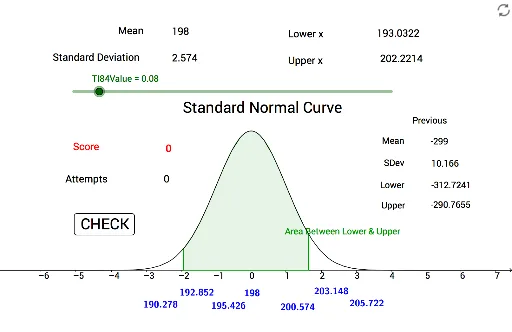
This example demonstrates how to use a TI84 calculator to calculate normal distribution probabilities. Key mathematical concepts include normal distribution, standard deviation, and random numbers. Using GeoGebra commands such as Random, Normal, and Integral, an interactive practice interface is constructed. Suitable for high school math education and students learning about normal distribution.
GeoGebra Commands & Parameters
Random(-300, 300) → xbarNormal(0, 1, x) → fIntegral(f, zUp, 6) → aIntegral(f, -6, zDwn) → bIntegral(f, zDwn, zUp) → cLaTeX(xbar) → text2LaTeX(two) → text4LaTeX(three) → text5LaTeX(none) → text6LaTeX(ntwo) → text7LaTeX(nthree) → text8LaTeX(one) → text9Text(xbar) → text3Text("Mean or xBar") → text10Text(stdev) → text11Text("Standard Deviation") → text12Text(xl) → text13Text("Lower x") → text14Text(xh) → text15Text("Upper x") → text16Text(score) → text17Text("Score") → text18Text(try) → text19Text("Attempts") → text20Text(pxbar) → text21Text("Previous") → text22Text("Mean") → text23Text(pstdev) → text24Text("SDev") → text25Text(pxl) → text26Text("Lower") → text27Text(pxh) → text28Text("Upper") → text29
AI Drawing Prompt Reference
Draw a standard normal distribution curve with x-axis ranging from -3 to 3. Calculate and display the area under the curve between -1 and 1, and between -2 and 2. Below the graph, show the randomly generated xBar value and standard deviation stdev, as well as the user-input lower and upper limits xl and xh.
The prompt above was compiled from the original drawing commands and is for reference only.