
Thor's Exponential Growth
Loading the math board and drawing, please wait…
In collections
Geom. & Alg.: Exponential Functions & Logarithms
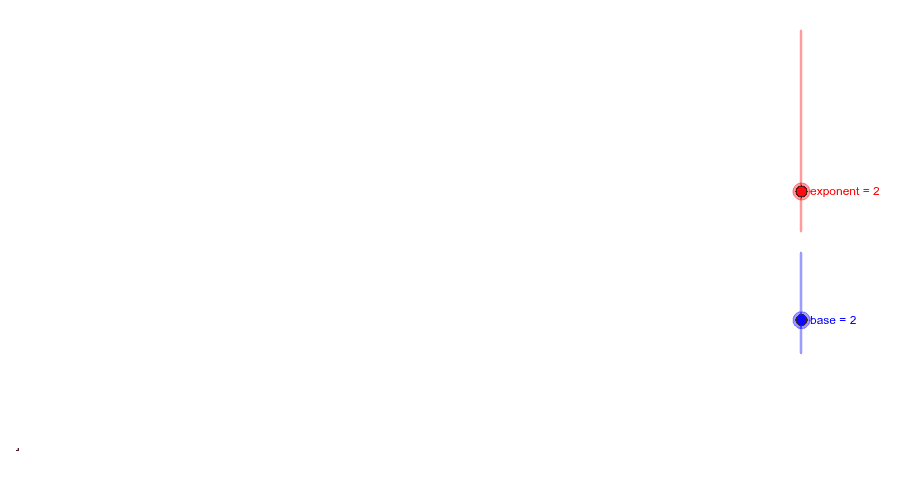
Move the exponent slider to observe Thor's exponential growth. This example demonstrates the dynamic changes of an exponential function, involving the core mathematical concept of exponential functions and their graphs. It uses GeoGebra objects and commands such as base, exponent, and a coefficient. Suitable for middle school and above students to learn about the properties and graph of exponential functions.
GeoGebra Commands & Parameters
Numeric base(2.0)Numeric exponent(2.0)a(x) = base^(x)a(exponent)
AI Drawing Prompt Reference
Draw an exponential function graph with base 2, where y=2^x. Set the base to 2 and the exponent to 2, then plot the graph of y=2^x. Use the slider to dynamically observe the growth of the exponential function.
The prompt above was compiled from the original drawing commands and is for reference only.