
The Geometric Meaning of 'a'
Loading the math board and drawing, please wait…
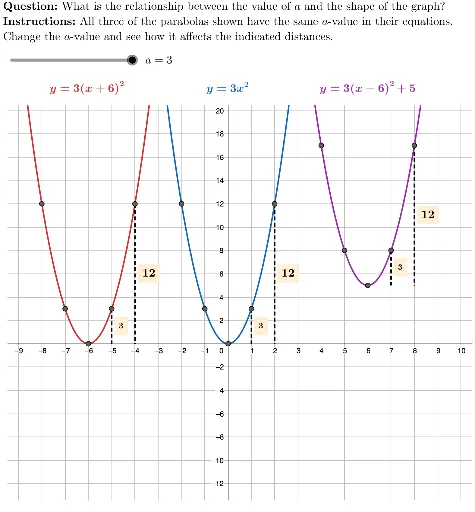
This example demonstrates the geometric meaning of the parameter 'a' in a quadratic equation. Key mathematical concepts include quadratic equations and geometric construction. Using GeoGebra commands such as Element, Point, and Segment, various geometric objects are constructed to show how changes in 'a' affect the shape. Suitable for high school mathematics education and learning the geometric meaning of quadratic equations.
GeoGebra Commands & Parameters
Element(sliderList, a) → trueAPoint(eq1) → APoint(eq1) → BPoint(eq1) → CPoint(eq1) → DPoint(eq1) → EPoint(eq2) → FPoint(eq2) → GPoint(eq2) → HPoint(eq2) → IPoint(eq2) → JPoint(eq3) → KPoint(eq3) → LPoint(eq3) → MPoint(eq3) → NPoint(eq3) → OSegment(I, (x(I), y(F))) → IsegSegment(E, (x(E), y(A))) → EsegSegment(D, (x(D), y(A))) → DsegSegment(N, (x(N), y(K))) → NsegSegment(O, (x(O), y(K))) → OsegSegment(J, (x(J), y(F))) → JsegMidpoint(Iseg) → ImidMidpoint(Jseg) → JmidMidpoint(Eseg) → EmidMidpoint(Dseg) → DmidMidpoint(Nseg) → NmidMidpoint(Oseg) → OmidLaTeX(twoUnitsCaption) → IcaptionLaTeX(twoUnitsCaption) → NcaptionLaTeX(twoUnitsCaption) → EcaptionLaTeX("\scriptsize" + (FractionText[abs(trueA)])) → oneUnitCaptionPolygon({(-9.5, -13.5), (-9.5, 20.5), (10.5, 20.5), (10.5, -13.5)}) → viewBoxLaTeX("\textbf{Instructions: }All three of the parabolas shown have the same \(a\)-value in their equations. \\Change the \(a\)-value and see how it affects the indicated distances.") → INSTRUCTIONSLaTeX("\textbf{Question: }What is the relationship between the value of \(a\) and the shape of the graph?") → QUESTIONLaTeX("\text{" + QUESTION + "\\" + INSTRUCTIONS + "}") → TEXT
AI Drawing Prompt Reference
Draw a graph of a quadratic equation with three parabolas that share the same a-value, all with their vertices on the y-axis. Observe how changing the a-value affects the shape of the parabolas, particularly the distance from the vertex to the focus. Start by drawing the parabolas, then mark key points, connect these points with segments, and finally label how the change in a-value impacts the graph.
The prompt above was compiled from the original drawing commands and is for reference only.