
The Craziest Function Graph
Loading the math board and drawing, please wait…
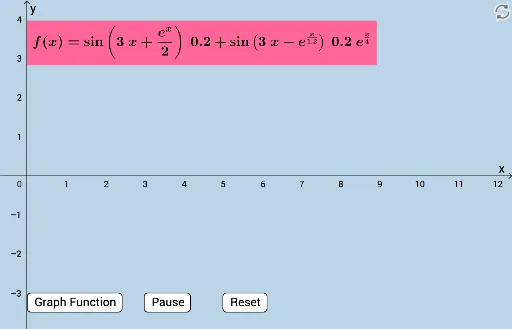
This is a dynamic example of the craziest function I've seen. It involves exponential functions and random variables. By adjusting parameters, you can observe changes in the function graph. The example uses functions, buttons, and slider animations in GeoGebra for construction. Suitable for high school math education and learning.
GeoGebra Commands & Parameters
f(x) = (sin((3 * x) + ℯ^(x) / 2) * 0.2) + ((sin((3 * x) - ℯ^(x / 1.2)) * 0.2) * ℯ^(x / 4))Numeric a(0)g(x) = If[0 ≤ x ≤ a, f(x)]Point A(4.062654916914735, 1.3410465545551065)Point B(5.677404797671576, 1.3410465545551065)
AI Drawing Prompt Reference
Draw a dynamic function graph involving exponential functions and random variables, and observe changes by adjusting parameters. First, draw the function f(x) = (sin((3 * x) + e^x / 2) * 0.2) + ((sin((3 * x) - e^(x / 1.2)) * 0.2) * e^(x / 4)). Then, create a slider a to limit the function g(x) within 0 ≤ x ≤ a. Finally, plot two points A and B on the x-axis with the same y-coordinate, located at (4.06, 1.34) and (5.68, 1.34) respectively.
The prompt above was compiled from the original drawing commands and is for reference only.