
The Basic Parabola Equation y=ax²: Dynamic Exploration
Loading the math board and drawing, please wait…
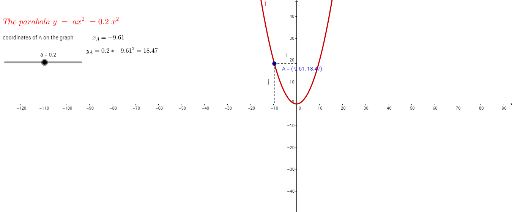
This GeoGebra example demonstrates the basic parabola y = ax² and how its shape and position on the plane change when the coefficient a is varied. The core mathematical concept is the relationship between the quadratic function's graph and its leading coefficient, including the direction of opening (upward for a>0, downward for a<0) and the width of the parabola (narrower for larger |a|). Construction details: a slider controls the parameter a; the Point command creates points on the parabola; OrthogonalLine and Intersect are used to construct perpendicular lines and their intersection points; Segment connects relevant points; text objects (text1 to text4) display coordinates for visual feedback. This resource is suitable for middle school to high school students learning quadratic function graphs, and for teachers demonstrating parameter effects in class.
GeoGebra Commands & Parameters
Point(f) → AOrthogonalLine(A, xAxis) → gOrthogonalLine(A, yAxis) → hIntersect(g, xAxis) → BIntersect(h, yAxis) → CSegment(C, A) → iSegment(A, B) → j
AI Drawing Prompt Reference
Draw a basic parabola y=ax² with a variable parameter a. First, create a slider for a, then draw the parabola y=ax². Next, pick a point A on the parabola and draw perpendicular lines from A to the x-axis and y-axis, which intersect the axes at points B and C, respectively. Connect points C and A, and then connect points A and B to form two segments.
The prompt above was compiled from the original drawing commands and is for reference only.