
Test Question 1: Histogram with Mixed Math Topics
Loading the math board and drawing, please wait…
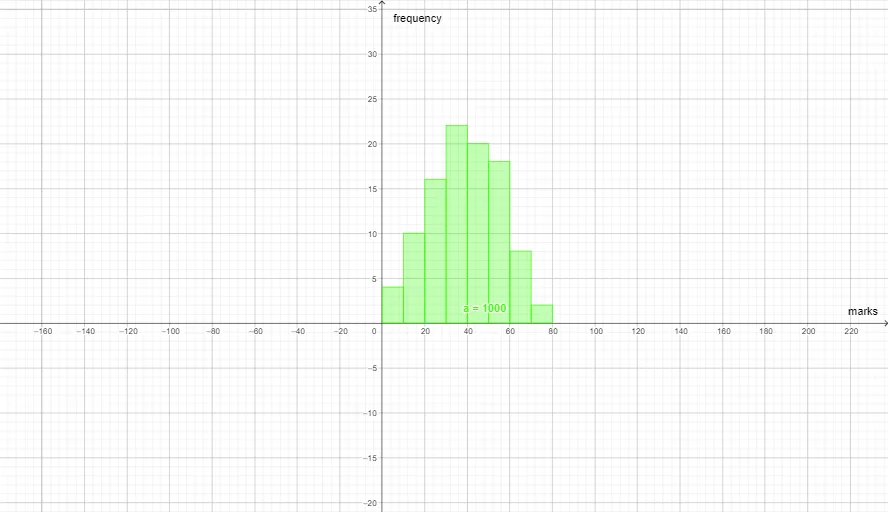
① This GeoGebra example, titled 'Test, question number1', primarily demonstrates the construction of a histogram, while also incorporating elements from cube geometry, isosceles triangles, quadratic functions, indefinite integrals, and hypergeometric distribution, creating a multi-topic mathematical display. ② Core mathematical concepts include statistical data representation via histograms, geometric properties of cubes and isosceles triangles, algebraic quadratic functions, calculus indefinite integrals, and probability hypergeometric distribution, showcasing an integrated approach to mathematics. ③ Construction details: Based on the summary, the Histogram command is used to generate the chart, with objects a, text1, and text2 created—likely for data values or annotations. The construction is straightforward, suitable for testing or demonstration purposes. ④ Target audience: This is appropriate for high school and above, useful for comprehensive math review or classroom teaching to visualize diverse concepts in a dynamic geometry environment.
GeoGebra Commands & Parameters
Histogram({0, 10, 20, 30, 40, 50, 60, 70, 80}, {4, 10, 16, 22, 20, 18, 8, 2}) → a
AI Drawing Prompt Reference
Create a histogram with data points at 0, 10, 20, 30, 40, 50, 60, 70, 80 and frequencies of 4, 10, 16, 22, 20, 18, 8, 2 respectively. The histogram should include data values and annotations, which may be used to label the data values or explain the histogram.
The prompt above was compiled from the original drawing commands and is for reference only.