
Bar Chart and Frequency Polygon Construction
Loading the math board and drawing, please wait…
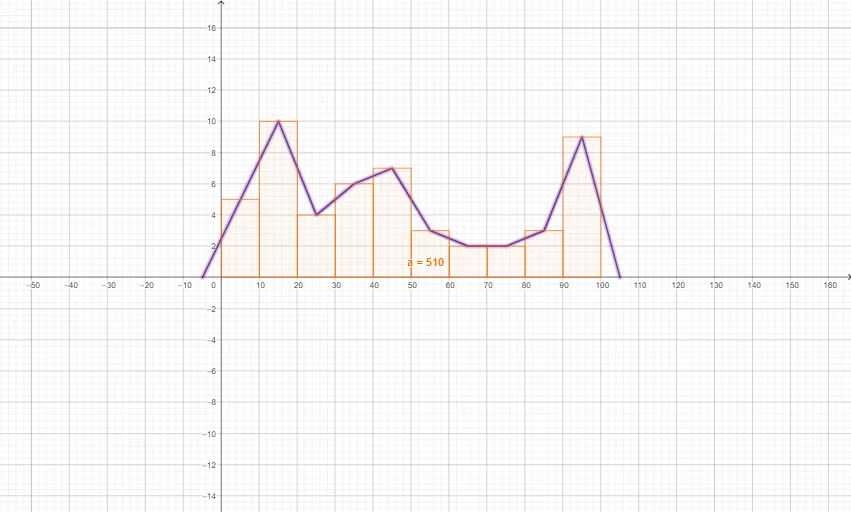
This example demonstrates how to use GeoGebra to create bar charts and frequency polygons. Key math concepts include data visualization, frequency distribution, histograms, and frequency polygons. Construction highlights involve using GeoGebra's Histogram and FrequencyPolygon commands. Suitable for high school mathematics teaching on data statistics and chart drawing.
GeoGebra Commands & Parameters
Histogram({0, 10, 20, 30, 40, 50, 60, 70, 80, 90, 100}, {5, 10, 4, 6, 7, 3, 2, 2, 3, 9}) → aFrequencyPolygon({0, 10, 20, 30, 40, 50, 60, 70, 80, 90, 100}, {5, 10, 4, 6, 7, 3, 2, 2, 3, 9}) → f
AI Drawing Prompt Reference
Create a frequency distribution histogram with ten equal intervals on the horizontal axis from 0 to 100, each of width 10. The vertical axis represents frequency, with values 5, 10, 4, 6, 7, 3, 2, 2, 3, 9 for the intervals respectively, shown as vertical bars whose heights are proportional to the frequencies. Overlay a frequency polygon by connecting the points at the midpoints of each interval with straight line segments, starting from the first midpoint and ending at the last, to clearly illustrate the data distribution trend.
The prompt above was compiled from the original drawing commands and is for reference only.