
Bar Chart and Triangle
Loading the math board and drawing, please wait…
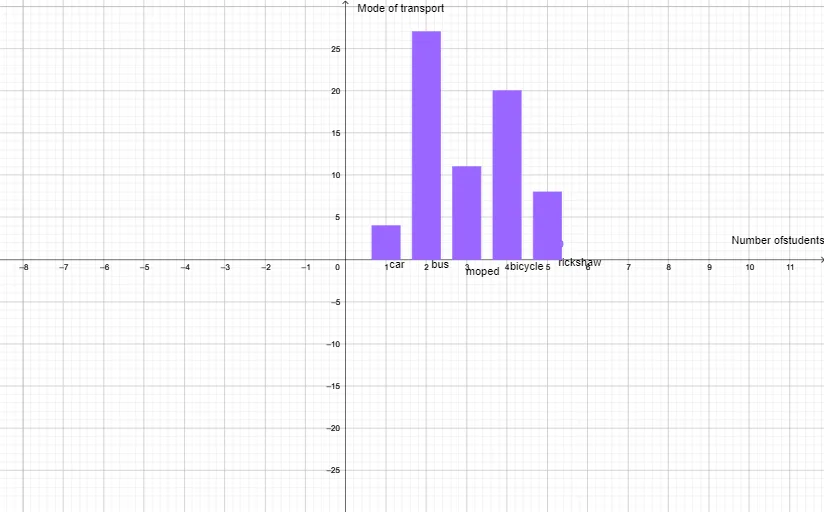
This example uses a bar chart to demonstrate the mode of different types of triangles and analyzes their properties. Key mathematical concepts include bar charts, types of triangles, and mode. The BarChart command is used to construct the bar chart, and text objects are used to display relevant data. Suitable for middle school and above students to learn about triangles and statistics.
GeoGebra Commands & Parameters
BarChart({1, 2, 3, 4, 5}, {4, 27, 11, 20, 8}, 0.7) → a
AI Drawing Prompt Reference
Draw a bar chart showing the number of five types of triangles with heights representing quantities 4, 27, 11, 20, 8, and a bar width of 0.7, with text annotations for each type's quantity and mode beside the bars.
The prompt above was compiled from the original drawing commands and is for reference only.