
Taylor Series of the Logarithm Function
Loading the math board and drawing, please wait…
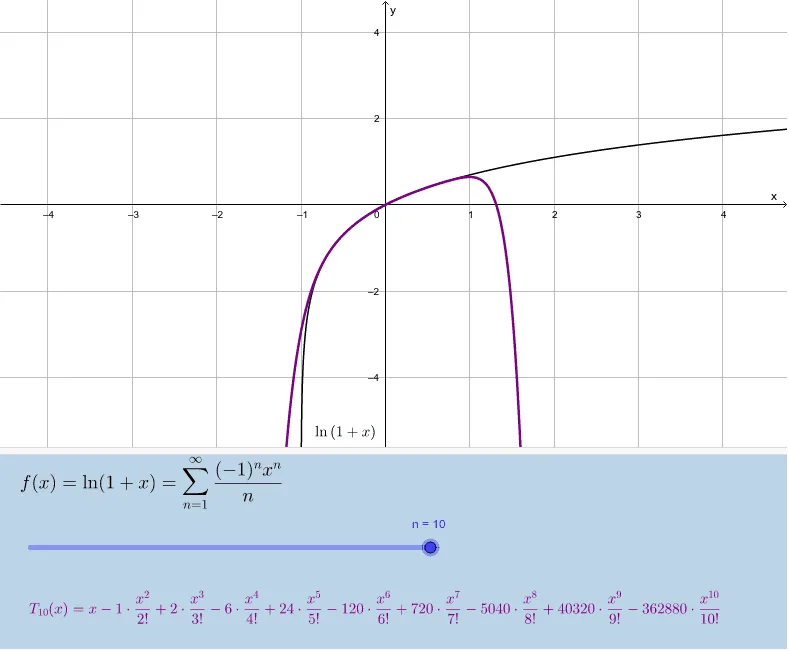
This GeoGebra example visualizes the Taylor series expansion of the natural logarithm function, demonstrating how polynomial approximations converge to the original curve. It covers core concepts such as Taylor polynomials, convergence, function approximation, and infinite series. The construction uses the TaylorSeries command, a slider n for the degree, an input box a for the expansion point, and text objects to display the series and error. Ideal for advanced high school or college calculus courses to explore the geometric meaning of Taylor expansion.
GeoGebra Commands & Parameters
TaylorSeries(f, a, n) → gTextfield(f) → InputBox1
AI Drawing Prompt Reference
Draw the graph of the natural logarithm function, showing its Taylor series expansion approximations. Include a smooth logarithmic curve and a Taylor polynomial curve controlled by a slider for the degree, which gradually approaches the original curve as the degree increases. Near the expansion point, the polynomial closely matches the logarithm, while farther away the deviation grows. Also include an input box to adjust the expansion point and text displays showing the polynomial expression and approximation error. The layout should clearly illustrate the geometric process of function approximation.
The prompt above was compiled from the original drawing commands and is for reference only.