
Taylor & Maclaurin Polynomial Grapher (n = 0 to 40)
Loading the math board and drawing, please wait…
In collections
BC Calculus
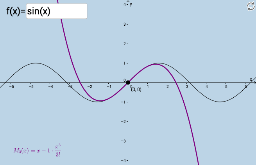
① This interactive GeoGebra example demonstrates how Taylor and Maclaurin polynomials of a user-defined function are graphed dynamically, with the degree n adjustable from 0 to 40 and the expansion point a changeable, visually showing how polynomials approximate the original curve near a. ② Core mathematical concepts include Taylor series, Maclaurin series, polynomial approximation, remainder terms, convergence behavior, and the role of differentiability in local approximation. ③ Construction highlights: the TaylorSeries command generates the polynomial of specified order; a Textfield allows input of the function; sliders control the expansion point a and degree n; objects include function f, polynomial g, point A, button1, InputBox1, and text1/text2 for dynamic updates and comparison. ④ Suitable for advanced high school or college calculus courses, this tool helps students grasp the geometric meaning of Taylor expansion, observe how increasing n improves approximation near a, and serves as an effective classroom demonstration or self-study resource.
GeoGebra Commands & Parameters
TaylorSeries(f, a, n) → gTextfield(f) → InputBox1
AI Drawing Prompt Reference
Create an interactive graph showing Taylor polynomial approximation of a user-defined function. Display the original function curve and its Taylor polynomial centered at a movable point. Include a slider to adjust the polynomial degree from 0 to 40, and another slider to change the expansion point. As the degree increases, the polynomial visibly converges to the original curve near the center. Add a text input for the function expression and dynamic labels showing the current degree and center value.
The prompt above was compiled from the original drawing commands and is for reference only.