
Taylor Inequality (LaGrange Error Bound)
Loading the math board and drawing, please wait…
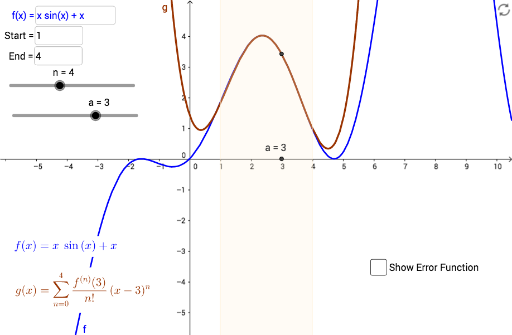
This example demonstrates how to use GeoGebra to plot the Taylor series expansion of a function and its error bound. Key math concepts include Taylor series, LaGrange error bound, and function approximation. Construction highlights the use of GeoGebra commands and objects like TaylorSeries, LaTeX, Derivative, Max, Textfield, and elements such as f, a, A, n, g, text1, h, a_1, a_2, B, R, InputBox1, InputBox2, l, C, b, R_{est}, InputBox3, D, text2, text3, n_1, text5, text6, text7, c, R_3, text8, d, text4, e. Suitable for university calculus courses or mathematical modeling education.
GeoGebra Commands & Parameters
TaylorSeries(f, a, n) → gLaTeX(g, true, true) → text1Derivative(f, n + 1) → hMax(abs(h(x)), a_1, a_2) → BTextfield(a_1) → InputBox1Textfield(a_2) → InputBox2Max(abs(l(x)), a_1, a_2) → CTextfield(f) → InputBox3