
Ostrowski Inequality Visualization: Error Bound via Derivative and Midpoint
Loading the math board and drawing, please wait…
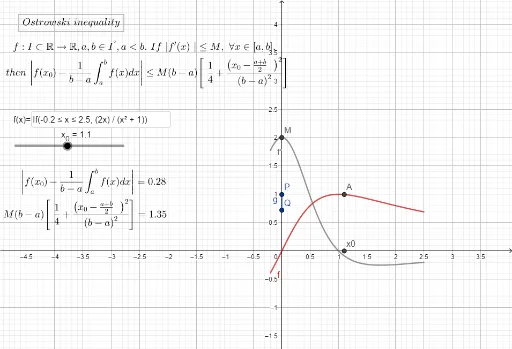
This GeoGebra example dynamically illustrates Ostrowski's inequality: for a differentiable function f on [a,b], the difference between the integral average and the function value at a point is bounded by the maximum absolute derivative times the interval length. The core mathematical concepts include integral mean value theorem refinements, derivatives, maxima, arithmetic and geometric means. Construction details: the Derivative command computes f', the Max command finds the maximum of |f'|, Segment constructs the interval, Textfield and InputBox allow parameter input, and dynamic text displays both sides of the inequality for comparison. Suitable for university-level mathematical analysis or numerical analysis courses, this tool helps students intuitively grasp how the error bound depends on interval length and derivative supremum, and serves as a visual aid for proving related inequalities.
GeoGebra Commands & Parameters
Derivative(f) → f'Max(f', a, b) → MTextfield(f) → InputBox1Segment(P, Q) → g
AI Drawing Prompt Reference
Create a dynamic illustration of Ostrowski's inequality, showing a function and its derivative, marking an interval, displaying the maximum absolute value of the derivative, allowing input for the function and interval, and dynamically comparing the difference between the integral average and the function value at a point to the product of the maximum derivative and interval length to understand how the error bound depends on the interval length and derivative supremum.
The prompt above was compiled from the original drawing commands and is for reference only.