
Modulus of Continuity Demonstration
Loading the math board and drawing, please wait…
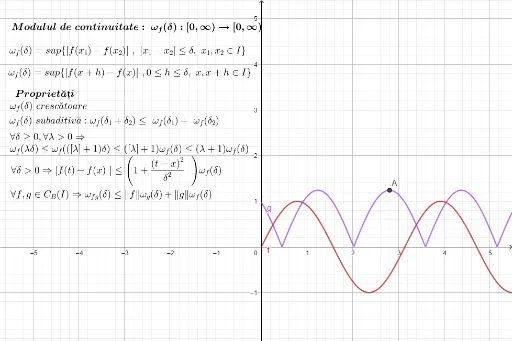
This example demonstrates the graph of the modulus of continuity function and its variation patterns. It involves core mathematical concepts such as continuity, variance, sequences and series, trigonometry, quadratic functions, and cubic functions. The construction uses GeoGebra commands like Max and objects including f, δ, h, g, A, and multiple text objects (text1 to text10). Suitable for high school and above students to understand the application of the modulus of continuity in function analysis.
GeoGebra Commands & Parameters
Max(g, 0, 5) → A
AI Drawing Prompt Reference
Draw a graph demonstrating the variation patterns of the modulus of continuity function, involving trigonometric, quadratic, and cubic functions, with annotations for key concepts like continuity, variance, sequences, and series. First, plot the function graph, then mark the maximum point within the range of 0 to 5.
The prompt above was compiled from the original drawing commands and is for reference only.