
Task 5: Angles, Scatter Plot, and Scalene Triangles
Loading the math board and drawing, please wait…
In collections
Dynamic Geometry Study Tasks
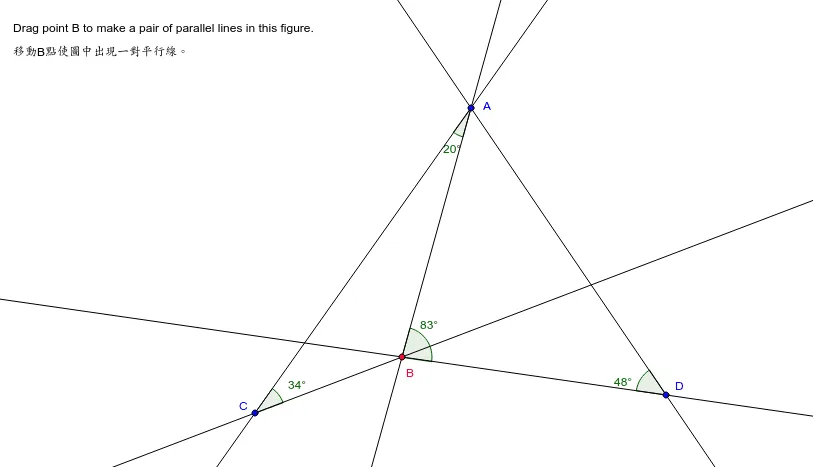
This example demonstrates how to construct dynamic geometric figures involving angles, scatter plots, and scalene triangles using GeoGebra. Key math concepts include angle measurement, scatter plot creation, triangle properties, cosine theorem, Poisson distribution, and calculus. The construction leverages commands like Line and Angle as outlined in the summary. Suitable for high school and above, it illustrates the integration of geometric construction and data analysis.
GeoGebra Commands & Parameters
Line(A, B) → aLine(A, C) → bLine(A, D) → cLine(C, B) → dLine(D, B) → eAngle(D, B, A) → αAngle(C, A, B) → βAngle(A, D, B) → γAngle(B, C, A) → δ
AI Drawing Prompt Reference
Draw a triangle formed by points A, B, and C. Connect these points with line segments to form the sides of the triangle. The three interior angles of triangle ABC are labeled as α, β, and γ. Ensure the triangle is equilateral by adjusting side lengths based on angle measurements. The figure should clearly show the angles and triangle structure, suitable for geometric teaching.
The prompt above was compiled from the original drawing commands and is for reference only.