
Tangent Definition and Graph
Loading the math board and drawing, please wait…
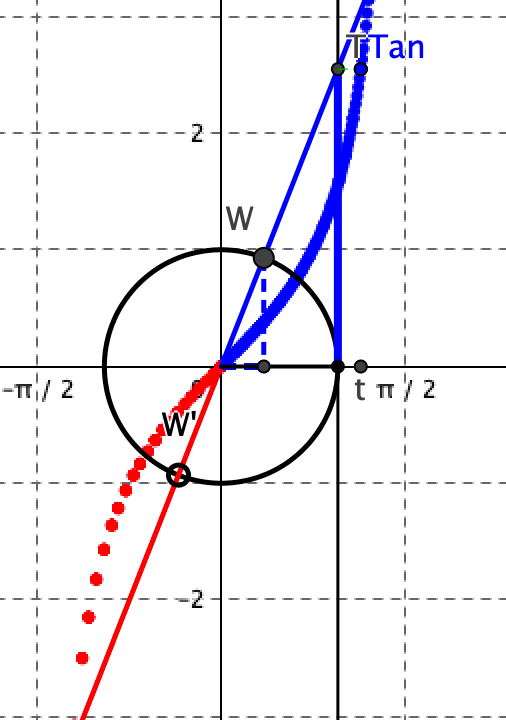
This example dynamically illustrates the concept of a tangent. It proves that tan = sin/cos by adjusting the angle. It involves core math concepts such as trigonometry, unit circle, and vectors. Using GeoGebra commands like Intersect, Circle, Line, Point, Segment, Textfield, Ray, etc., it constructs dynamic mathematical graphics. Suitable for high school math education and learning.
GeoGebra Commands & Parameters
Intersect(xAxis, yAxis) → OCircle(O, 1) → cLine(O, W) → bIntersect(a, b) → TPoint(xAxis) → ASegment(W, X) → SINSegment(O, X) → COSSegment(O, A) → OASegment(A, T) → BTTextfield(speed) → SPDRay(O, W') → RayOW'Ray(O, W) → RayOWTextfield(t) → tEqIf(togA ≟ 1, "Turn Animation Off", "Turn Animation On") → ToggleAnimationIf(togTr ≟ 1, "Stop Traces", "Show Traces") → Traces