
T-Test of a Mean
Loading the math board and drawing, please wait…
In collections
Learn GeoGebra Classic
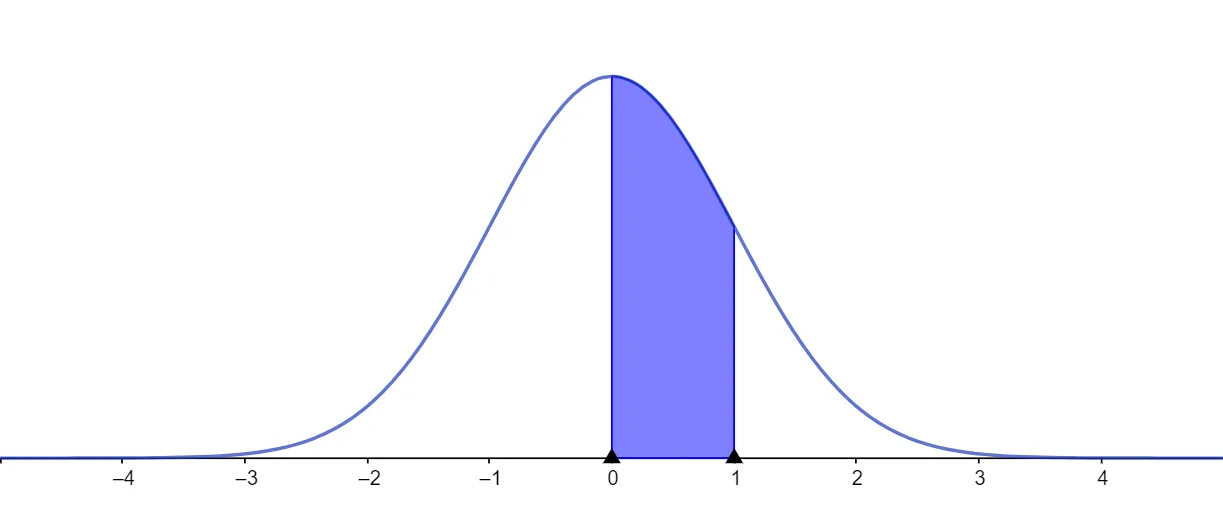
This example demonstrates how to conduct a T-Test of a Mean. It covers key statistical concepts such as sample mean, standard deviation, and degrees of freedom. By adjusting the sample data, you can observe changes in the T-test results. GeoGebra's slider animation is used to dynamically show how data changes affect the T-test outcomes. Suitable for high school and above students learning statistics and data analysis.
AI Drawing Prompt Reference
Create a T-test of a mean diagram, illustrating concepts such as sample mean, standard deviation, and degrees of freedom. Adjust the sample data to observe changes in the T-test results. Use a slider animation to dynamically show how data changes affect the T-test outcomes.
The prompt above was compiled from the original drawing commands and is for reference only.