
Systems of Inequalities Example
Loading the math board and drawing, please wait…
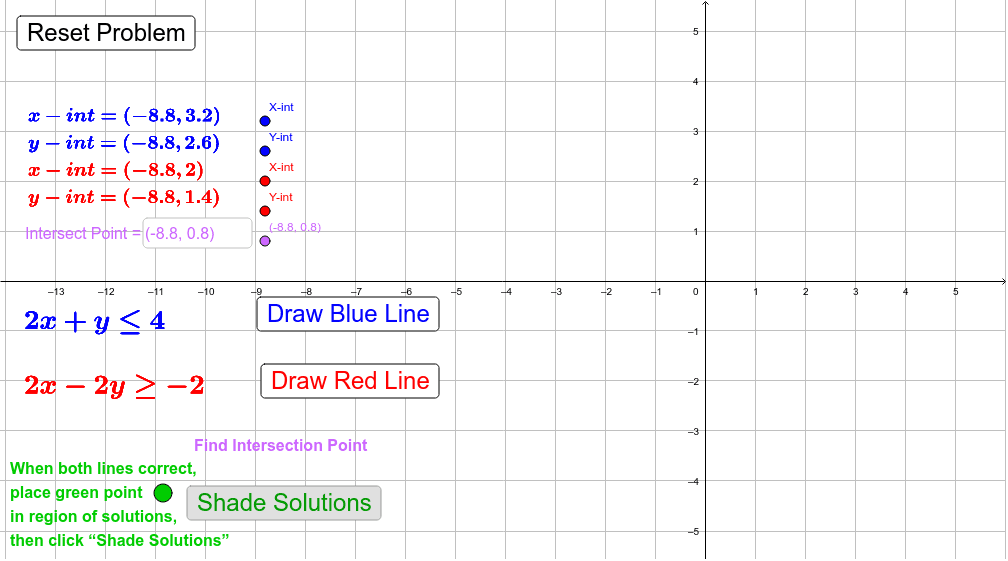
This example demonstrates how to plot the solution set of a system of inequalities in a coordinate system, highlighting the intersection region. Core math concepts include inequalities, region representation, and intersection solving. Construction highlights the use of GeoGebra commands/objects like Intersect (to find intersections), Line (to draw lines), IsInRegion (to determine regions), and Textfield (for text display). Suitable for high school students learning about systems of inequalities and their geometric interpretations.
GeoGebra Commands & Parameters
Intersect(rline, bline) → IntPtLine(SRXI, SRYI) → SrlineLine(SBXI, SBYI) → SblineIntersect(bline, x = 0) → CBYIIntersect(bline, y = 0) → CBXIIntersect(rline, y = 0) → CRXIIntersect(rline, x = 0) → CRYIIsInRegion(SOP, overlap) → SoverlapcorrectTextfield(SIP) → InputBox1
AI Drawing Prompt Reference
Create a coordinate-plane illustration of a system of inequalities: draw two straight boundary lines, mark their intersection point and the points where each line meets the horizontal and vertical axes, shade the common solution region where both inequalities overlap, place a test point inside that shaded region to indicate membership, and add a text input box for displaying or entering the inequality conditions. The result should look like a high-school geometry example of inequality regions and their intersection.
The prompt above was compiled from the original drawing commands and is for reference only.