
Systems of Inequalities Demo by Garret Cahill
Loading the math board and drawing, please wait…
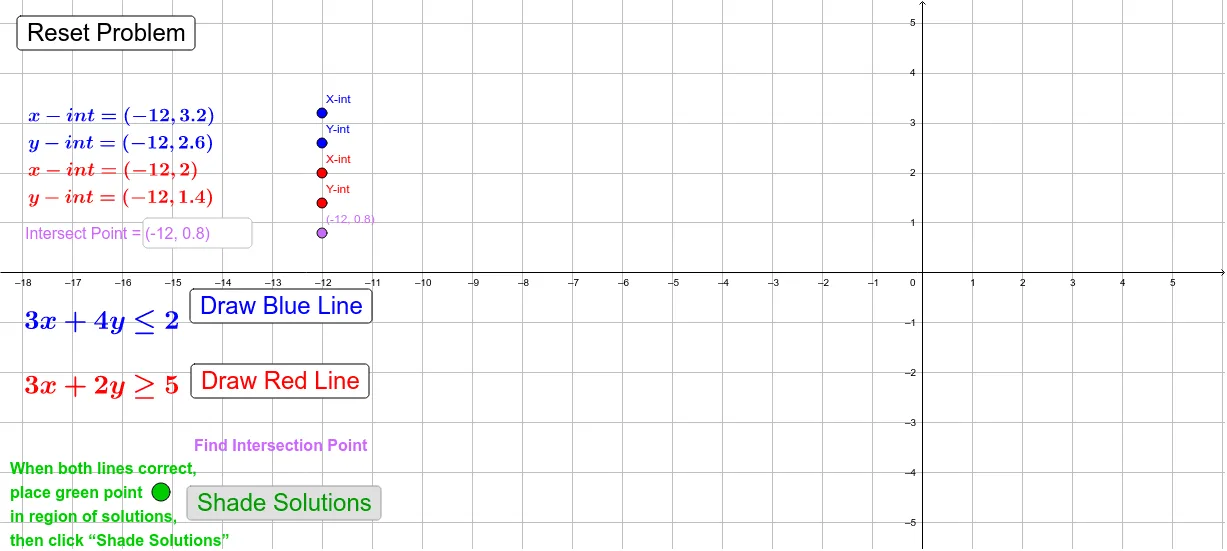
This example demonstrates how to plot and solve systems of inequalities in a coordinate system, highlighting the concept of regions and intersection points. Key GeoGebra commands and objects used include Intersect, Line, IsInRegion, and Textfield. Suitable for high school students learning about inequalities and their geometric interpretations, or for teaching upper and lower sums/Riemann sums in calculus.
GeoGebra Commands & Parameters
Intersect(rline, bline) → IntPtLine(SRXI, SRYI) → SrlineLine(SBXI, SBYI) → SblineIntersect(bline, x = 0) → CBYIIntersect(bline, y = 0) → CBXIIntersect(rline, y = 0) → CRXIIntersect(rline, x = 0) → CRYIIsInRegion(SOP, overlap) → SoverlapcorrectTextfield(SIP) → InputBox1
AI Drawing Prompt Reference
Draw two lines on a Cartesian plane as the boundaries of a system of inequalities, mark their intersection point and the four axis intercepts; shade the half‑plane for each inequality and highlight the overlapping region; add a draggable test point that shows whether it lies inside the overlap; and include a coordinate input box for the user to enter a point manually.
The prompt above was compiled from the original drawing commands and is for reference only.