
Systems of Inequalities - Classwork 1
Loading the math board and drawing, please wait…
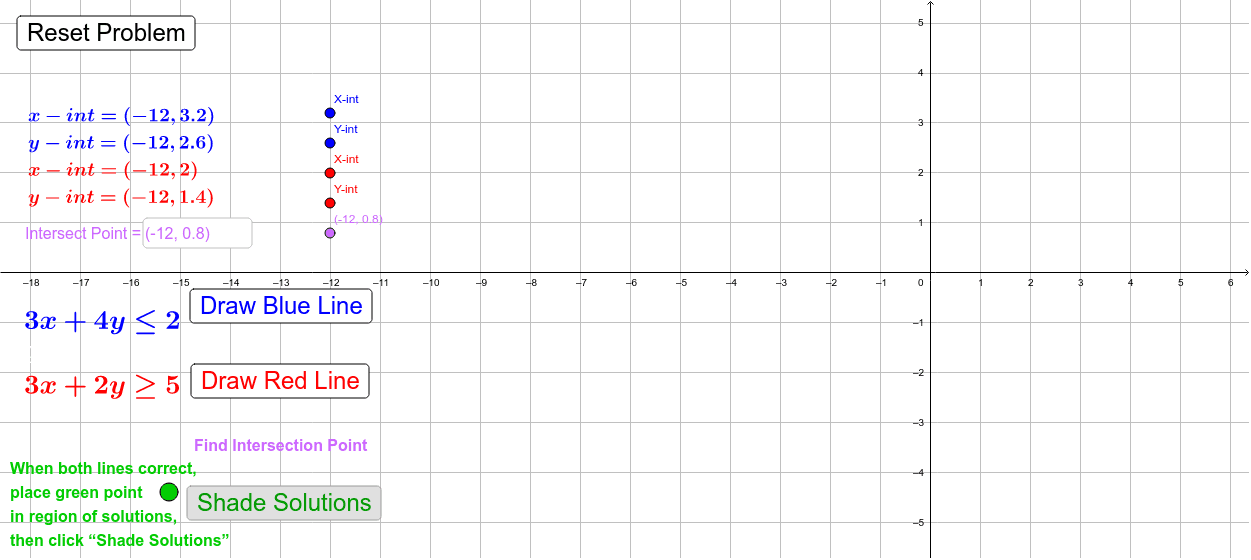
This example demonstrates how to plot and analyze the solution set of a system of inequalities in the coordinate plane. Key math concepts include inequalities, region representation, and intersection solving. GeoGebra commands/objects used are Intersect, Line, IsInRegion, and Textfield. Suitable for high school students to understand the geometric meaning and methods of solving systems of inequalities, applicable for classroom demonstrations or homework exercises.
GeoGebra Commands & Parameters
Intersect(rline, bline) → IntPtLine(SRXI, SRYI) → SrlineLine(SBXI, SBYI) → SblineIntersect(bline, x = 0) → CBYIIntersect(bline, y = 0) → CBXIIntersect(rline, y = 0) → CRXIIntersect(rline, x = 0) → CRYIIsInRegion(SOP, overlap) → SoverlapcorrectTextfield(SIP) → InputBox1
AI Drawing Prompt Reference
Draw two lines in a coordinate plane and mark their intersection point. Then, determine and shade the region enclosed by the lines based on inequalities, marking the points where the region intersects the x-axis and y-axis. Finally, add a text box next to the graph for inputting inequalities and display a correctness check for the overlap between the region and the inequalities.
The prompt above was compiled from the original drawing commands and is for reference only.