
Swallowtail Catastrophe Curves
Loading the math board and drawing, please wait…
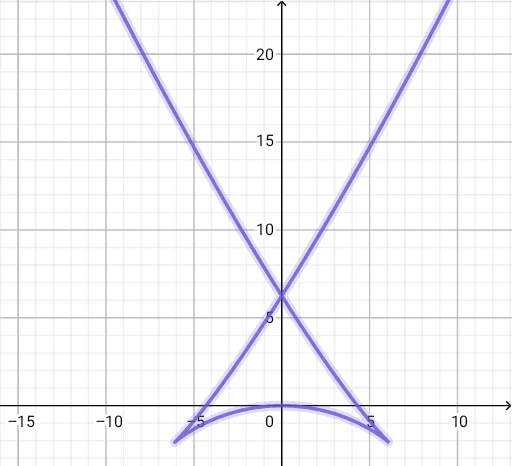
This example demonstrates the function graph of the Swallowtail Catastrophe Curves, a classic bifurcation phenomenon. Key math concepts include parametric equations, piecewise functions, graphing, and dynamic manipulation. The construction utilizes GeoGebra's CurveCartesian command with objects c and a for parameterization. Suitable for high school and above students to explore complex function behavior and geometric shapes.
GeoGebra Commands & Parameters
CurveCartesian(((2 * c) * t) - (4 * t^(3)), ((-c) * t^(2)) + (3 * t^(4)), t, -5, 5) → a
AI Drawing Prompt Reference
Draw a parametric curve defined by two functions of variable t, where the x-coordinate is 2c times t minus 4t cubed, and the y-coordinate is -c times t squared plus 3t to the fourth power, with t ranging from -5 to 5, showcasing the function graph of the Swallowtail Catastrophe Curves for exploring complex function behavior and geometric shapes.
The prompt above was compiled from the original drawing commands and is for reference only.