
Suspect Inequalities Solutions in New York
Loading the math board and drawing, please wait…
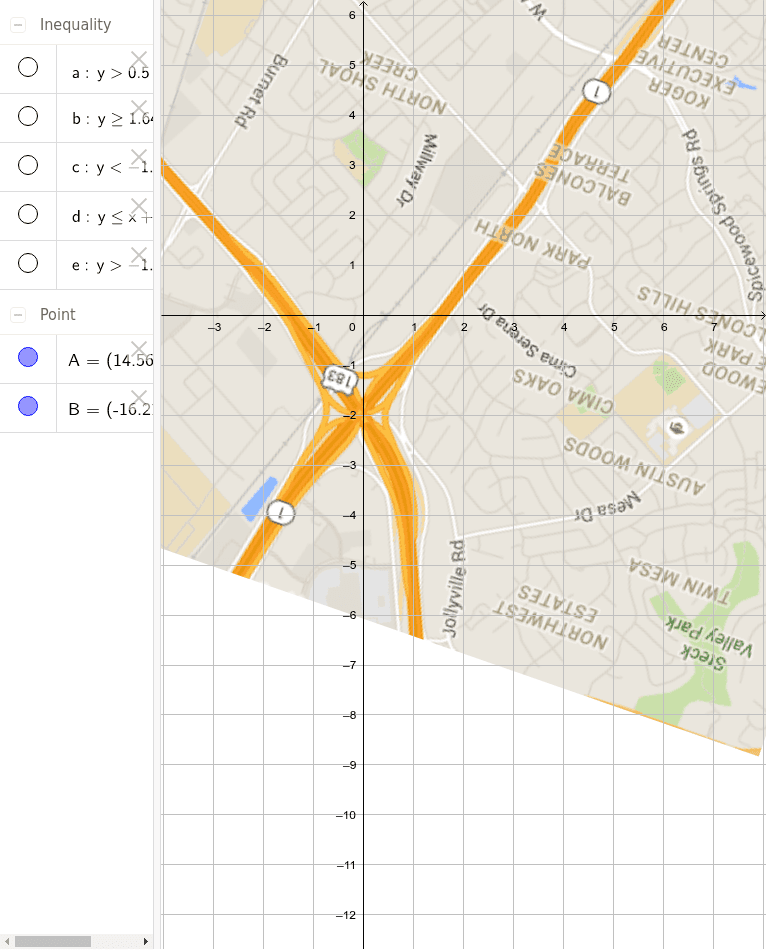
This example demonstrates the solutions of suspect inequalities in New York. Key mathematical concepts include inequalities, arithmetic mean, division, and definite integrals. Using GeoGebra commands such as objects A, B, pic1, a, b, c, d, e, the solution set of the inequality is constructed. Suitable for high school mathematics education and students learning inequality solutions.
GeoGebra Commands & Parameters
Point A(14.55867, 10.27898)Point B(-16.20557, 20.98825)a(x, y) = y > (0.5 * x^(2)) - 2b(x, y) = y ≥ (1.64 * x) + 7.78c(x, y) = y < ((-1.11) * x) + 10.04d(x, y) = y ≤ x + 23.39e(x, y) = y > ((-1.06) * x) + 0.83
AI Drawing Prompt Reference
Draw a graph in New York with points A and B, and curves defined by inequalities a, b, c, d, e. a is a parabola, b, c, d, e are lines. The construction order is to draw points first, then inequalities, and finally the regions.
The prompt above was compiled from the original drawing commands and is for reference only.