
Surfaces in Space
Loading the math board and drawing, please wait…
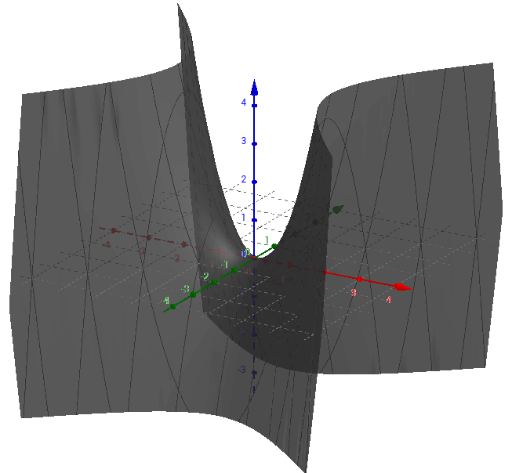
This example demonstrates how to plot surfaces in three-dimensional space, involving core mathematical concepts such as function graphs, coordinate geometry, and solid geometry. Using GeoGebra commands like CurveCartesian, Sequence, Point, and Textfield, users can create and display various parts of the surface, such as contour lines and function values at specific points. Key construction steps include defining functions, generating sequences, positioning key points, and adding text annotations. Suitable for high school and above students to learn about the relationship between spatial geometry and function graphs.
GeoGebra Commands & Parameters
CurveCartesian((x_0, t, f(x_0, t)), t, -10, 10) → x_0IntCurveCartesian((t, y_0, f(t, y_0)), t, -10, 10) → y_0IntSequence(CurveCartesian[(n, t, f(n, t)), t, -10, 10], n, -5, 5, Δ) → xCross3DSequence(CurveCartesian[(t, n, f(t, n)), t, -10, 10], n, -5, 5, Δ) → yCross3DSequence(f(x, y) = n, n, -5, 5, Δ) → contoursPoint(f_{z_0}) → ASequence(f(x, n), n, -5, 5, Δ) → yCrossTextfield(f) → InputBox1Sequence(f(n, x), n, -5, 5, Δ) → xCross