
Sum and Products: Visual Guide to Factoring Quadratics
Loading the math board and drawing, please wait…
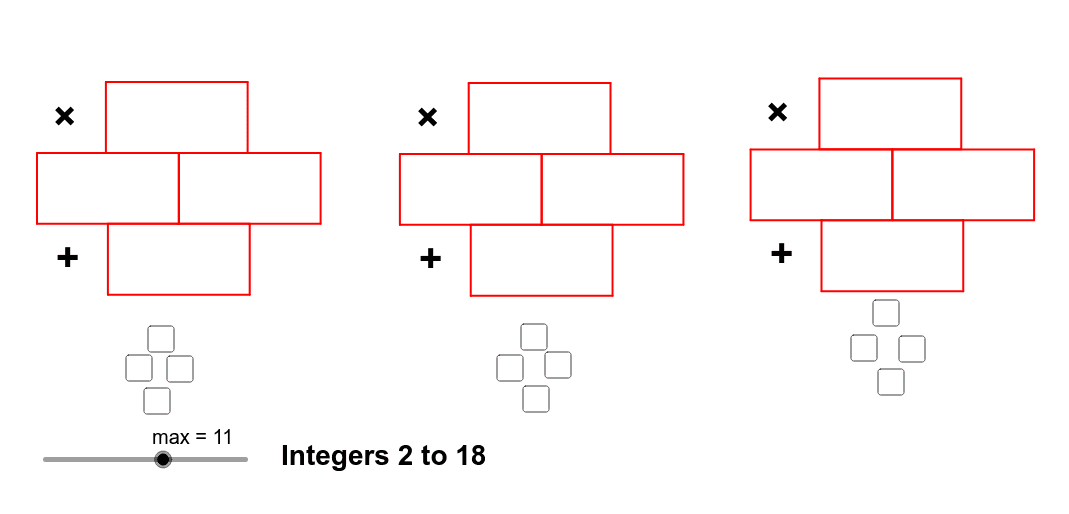
① This example dynamically demonstrates the relationship between the sum and product of two factors and the factoring of quadratic expressions, helping learners understand how to reverse-engineer factors from given sum and product. ② The core mathematical concept is factoring quadratic polynomials, focusing on the interplay between factors, their product, their sum, and the coefficients of the quadratic. ③ Construction highlights: The GeoGebra commands used include Random to generate random factors, Point and Polygon to construct area models (rectangles), and text objects to display the computed sum and product. Multiple polygons (poly1, poly1_1, etc.) and points (A, B, C, D, etc.) are used to build a visual representation, likely with dynamic updates or sliders. ④ This is suitable for middle school to high school students learning algebraic factoring, and for teachers as a classroom demonstration tool to reinforce intuitive understanding through visual area models.
GeoGebra Commands & Parameters
Random((-max), max) → factor21Random((-max), max) → factor22Point(Circle[A, 5]) → BPolygon(A, B, C, D) → poly1, a, b, c, dPoint(Circle[A_1, 5]) → B_1Polygon(A_1, B_1, C_1, D_1) → poly1_1, a_1, b_1, c_1, d_1Point(Circle[A_2, 5]) → B_2Polygon(A_2, B_2, C_2, D_2) → poly1_2, a_2, b_2, c_2, d_2Point(Circle[A_3, 5]) → B_3Polygon(A_3, B_3, C_3, D_3) → poly1_3, a_3, b_3, c_3, d_3Random((-max), max) → factor32Random((-max), max) → factor31Point(Circle[A_4, 5]) → B_4Polygon(A_4, B_4, C_4, D_4) → poly1_4, a_4, b_4, c_4, d_4Point(Circle[A_5, 5]) → B_5Polygon(A_5, B_5, C_5, D_5) → poly1_5, a_5, b_5, c_5, d_5Point(Circle[A_6, 5]) → B_6Polygon(A_6, B_6, C_6, D_6) → poly1_6, a_6, b_6, c_6, d_6Point(Circle[A_7, 5]) → B_7Polygon(A_7, B_7, C_7, D_7) → poly1_7, a_7, b_7, c_7, d_7Random((-max), max) → factor11Random((-max), max) → factor12Point(Circle[A_8, 5]) → B_8Polygon(A_8, B_8, C_8, D_8) → poly1_8, a_8, b_8, c_8, d_8Point(Circle[A_9, 5]) → B_9Polygon(A_9, B_9, C_9, D_9) → poly1_9, a_9, b_9, c_9, d_9Point(Circle[A_{10}, 5]) → B_{10}Polygon(A_{10}, B_{10}, C_{10}, D_{10}) → poly1_{10}, a_{10}, b_{10}, c_{10}, d_{10}Point(Circle[A_{11}, 5]) → B_{11}Polygon(A_{11}, B_{11}, C_{11}, D_{11}) → poly1_{11}, a_{11}, b_{11}, c_{11}, d_{11}
AI Drawing Prompt Reference
Create a visual area model for factoring quadratic expressions. The drawing should include multiple rectangles, each formed by four corner points, representing the product of two factors. Randomly generate several pairs of factors, each pair corresponding to one rectangle whose side lengths represent the two factors. Display the sum and product of these factors near or inside each rectangle. The overall layout should clearly show the relationship between factors, their sum, product, and the coefficients of a quadratic polynomial. Include sliders or dynamic elements to adjust the range of factors. The graphic should emphasize the intuitive connection between area and algebraic expressions.
The prompt above was compiled from the original drawing commands and is for reference only.