
Student Pet Preference Survey Analysis
Loading the math board and drawing, please wait…
In collections
UCSS Secondary Math I Unit 4 Lesson 2
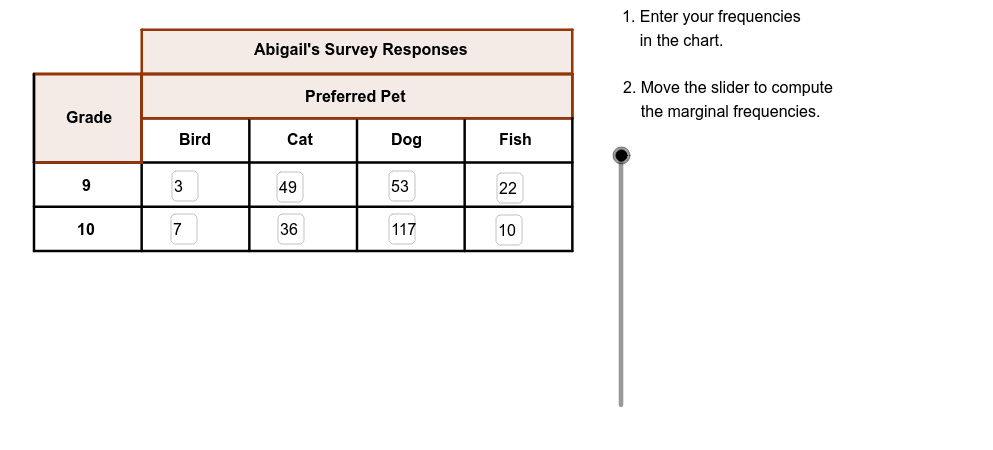
This example demonstrates how to analyze data distribution of student pet preferences through charts. Core math concepts include data statistics, probability & statistics, and chart drawing. GeoGebra commands and objects used are Textfield, Segment, Polygon, Vector. Suitable for high school mathematics teaching, focusing on data analysis and statistical chart creation.
GeoGebra Commands & Parameters
Textfield(B3) → bird9Textfield(B4) → bird10Textfield(C3) → cat9Textfield(C4) → cat10Textfield(D3) → dog9Textfield(D4) → dog10Textfield(E3) → fish9Textfield(E4) → fish10Segment(C, D) → bSegment(E, F) → cSegment(G, H) → dSegment(I, J) → eSegment(A, M) → gSegment(N, K) → hSegment(M, K) → iSegment(O, P) → jSegment(Q, R) → kSegment(S, T) → lSegment(B, L) → mPolygon(C, N, K, M) → poly1, n, p, q, rPolygon(C, U, O, A) → GradePoly, s, t, a_1, b_1Segment(A, S) → aSegment(K, T) → fPolygon(S, B, V, D) → poly2, s_1, b_2, v, d_1Polygon(F, A1, W, H) → poly3, f_1, a1, w, h_1Polygon(Z, L, T, J) → poly4, z, l_1, t_1, j_1Vector(A_1, B_1) → uVector(C_1, D_1) → u_1Vector(E_1, F_1) → v_1Vector(G_1, H_1) → w_1Polygon(I_1, M_1, M, L_1) → Title, c_1, e_1, g_1, i_1
AI Drawing Prompt Reference
Create a chart to analyze student pet preference data, featuring text boxes showing counts for different pets, line segments and vectors illustrating data relationships, and polygons forming the chart's components, starting with a basic structure and then adding details to present a geometric model of data statistics and probability distribution.
The prompt above was compiled from the original drawing commands and is for reference only.