
Stretching the y=1/x Graph (Part 2)
Loading the math board and drawing, please wait…
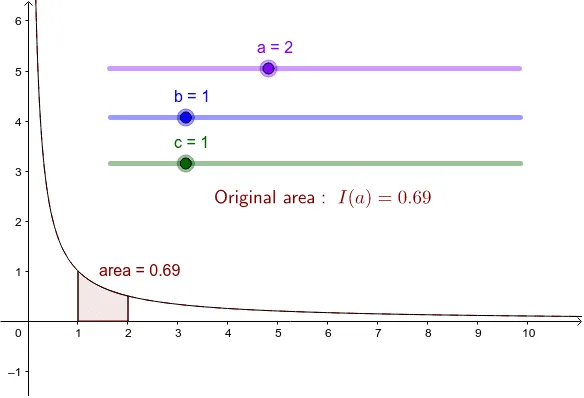
This example explores the changes in area under the y=1/x graph through stretching. Key mathematical concepts include function graph transformation, integration, and area calculation. It uses Segment, Integral, and other GeoGebra commands, suitable for high school mathematics education.
GeoGebra Commands & Parameters
Segment(A, B) → seg1Segment(C, D) → seg2Integral(f, b, (a * b)) → areaIntegral(g, 1, a) → origarea
AI Drawing Prompt Reference
Draw the graph of the function y=1/x and show the change in the area under the curve after stretching. Start by drawing two line segments, then calculate the integral area of the original function from 1 to a and the integral area of the stretched function from a to b, using different colors or styles to distinguish these areas for a clear comparison of the change in area.
The prompt above was compiled from the original drawing commands and is for reference only.