
Straight Line Simulation
Loading the math board and drawing, please wait…
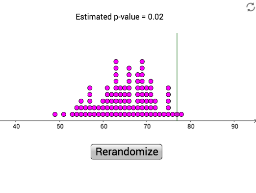
This example demonstrates how to use GeoGebra to draw straight lines and related statistical distributions. It covers key concepts such as straight lines, normal distribution, and frequency distribution. By using Sequence, DotPlot, and Segment commands, users can dynamically observe and analyze data. Suitable for high school mathematics education and learning.
GeoGebra Commands & Parameters
Sequence(RandomBinomial[185, 0.35], a, 1, 100) → list1DotPlot(list1, false, 0.3) → list2Segment((77, 0), (77, 4)) → f