
Stereographic Projection of Coordinate Grid to Sphere
Loading the math board and drawing, please wait…
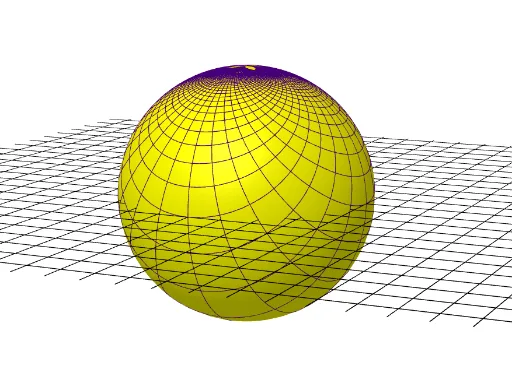
This example demonstrates the stereographic projection of a coordinate grid onto a sphere. Key mathematical concepts include projective geometry and spherical geometry. Using the GeoGebra commands Sequence, a series of lines are generated to project the plane coordinate grid onto the sphere. Suitable for high school students or math enthusiasts studying projective and spherical geometry.
GeoGebra Commands & Parameters
Sphere((0, 0, 0), 1) → aSequence(Line[(w, 0, 0), (w, 1, 0)], w, -10, 10, 0.25) → L_3Sequence(Line[(0, w, 0), (1, w, 0)], w, -10, 10, 0.25) → L_4Sequence(IntersectPath[Plane[A, Line[(0, w, 0), (1, w, 0)]], a], w, -8, 8, 0.25) → L_1Sequence(IntersectPath[Plane[A, Line[(w, 0, 0), (w, 1, 0)]], a], w, -8, 8, 0.25) → L_2
AI Drawing Prompt Reference
Draw a sphere with a radius of 1, then project a grid of lines parallel to the x-axis and y-axis from the plane onto the sphere. First, draw the sphere, then create a series of lines parallel to the x-axis, followed by a series of lines parallel to the y-axis. Finally, find the intersection points of these lines with the sphere's surface to form the projected grid.
The prompt above was compiled from the original drawing commands and is for reference only.