
Step-by-Step Guide to Graphing Rational Functions
Loading the math board and drawing, please wait…
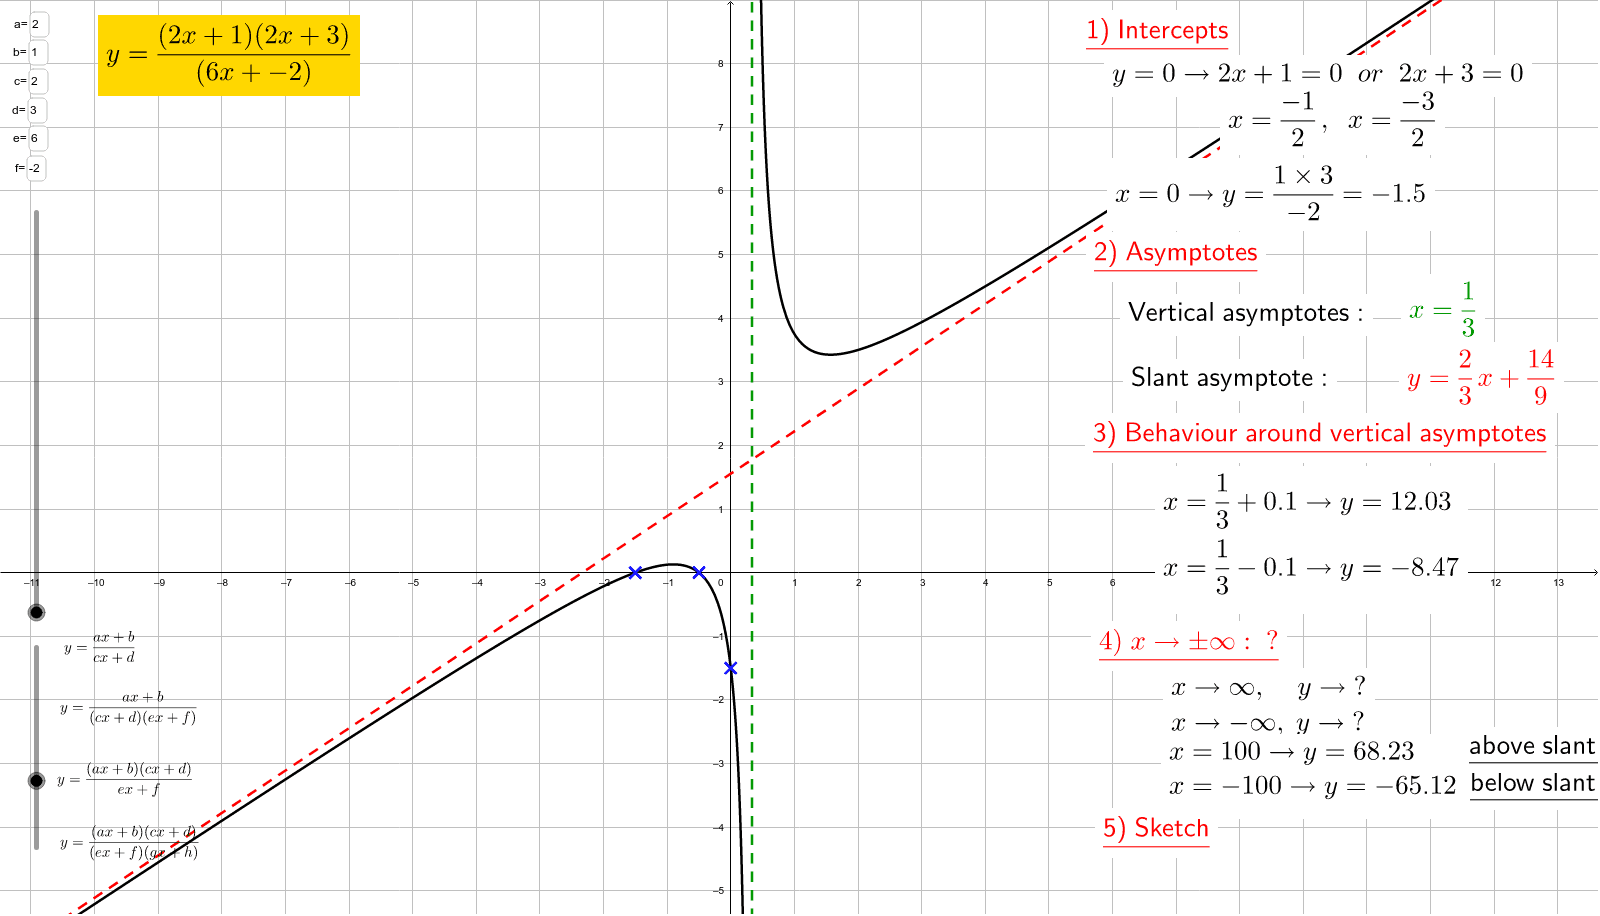
This GeoGebra example demonstrates how to plot rational function graphs step by step using interactive input fields and sliders, allowing users to observe how parameter changes affect the shape of the graph. The core mathematical concepts include rational functions, vertical/horizontal/oblique asymptotes, zeros, poles, and transformations of function graphs. The construction uses GeoGebra's Textfield command to create multiple input boxes (inputBox1 to inputBox8) for entering coefficients of numerator and denominator polynomials (a, b, c, d, e, f, g, h), along with dynamic text objects (text1 to text13) that display the function expression and key points (such as points A and B) in real time. This resource is suitable for high school or pre-university students learning function analysis, and for teachers to use in classroom demonstrations to help students intuitively understand the structure and graphical behavior of rational functions.
GeoGebra Commands & Parameters
Textfield(a) → inputBox1Textfield(b) → inputBox2Textfield(c) → inputBox3Textfield(d) → inputBox4Textfield(e) → inputBox5Textfield(f) → inputBox6Textfield(g) → inputBox7Textfield(h) → inputBox8