
Stem and Leaf Display for One Data Set
Loading the math board and drawing, please wait…
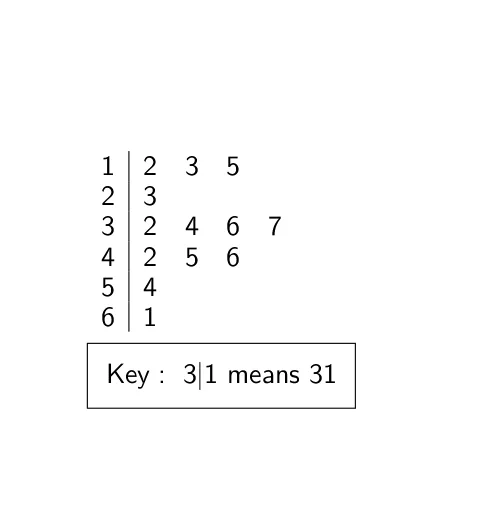
This example demonstrates how to create a stem-and-leaf plot for a single data set, a statistical chart used to quickly visualize the distribution shape of numerical data. The core mathematical concept is descriptive statistics and data visualization, where each data point is split into a stem (leading digits) and a leaf (trailing digit) to reveal central tendency, spread, and potential outliers. The construction uses GeoGebra's StemPlot command, with a dataSet object storing the raw values, and the parameter multDefaultstemByTenToThePowerOf adjusting the stem scaling factor, ultimately producing a text1 object containing the plot. This example is suitable for middle or high school students learning statistical charts, helping them understand data organization and preliminary analysis. It can be used in classroom demonstrations or for self-directed exploration of data distribution characteristics.
GeoGebra Commands & Parameters
StemPlot(dataSet, multDefaultstemByTenToThePowerOf) → text1
AI Drawing Prompt Reference
Create a stem-and-leaf plot for a single dataset to visualize the distribution of numerical data. Split each data point into a stem (leading digits) and a leaf (trailing digit), with stems scaled by powers of ten arranged on the left and leaves listed sequentially on the right, forming a table-like statistical chart. Include a dataset object holding the raw values and a final text display of the plot. The chart should clearly show central tendency, spread, and potential outliers, suitable for middle or high school statistics teaching.
The prompt above was compiled from the original drawing commands and is for reference only.