
Statistics: Small Data Set (5) – Mean, Median, and Kite Parametric Curves
Loading the math board and drawing, please wait…
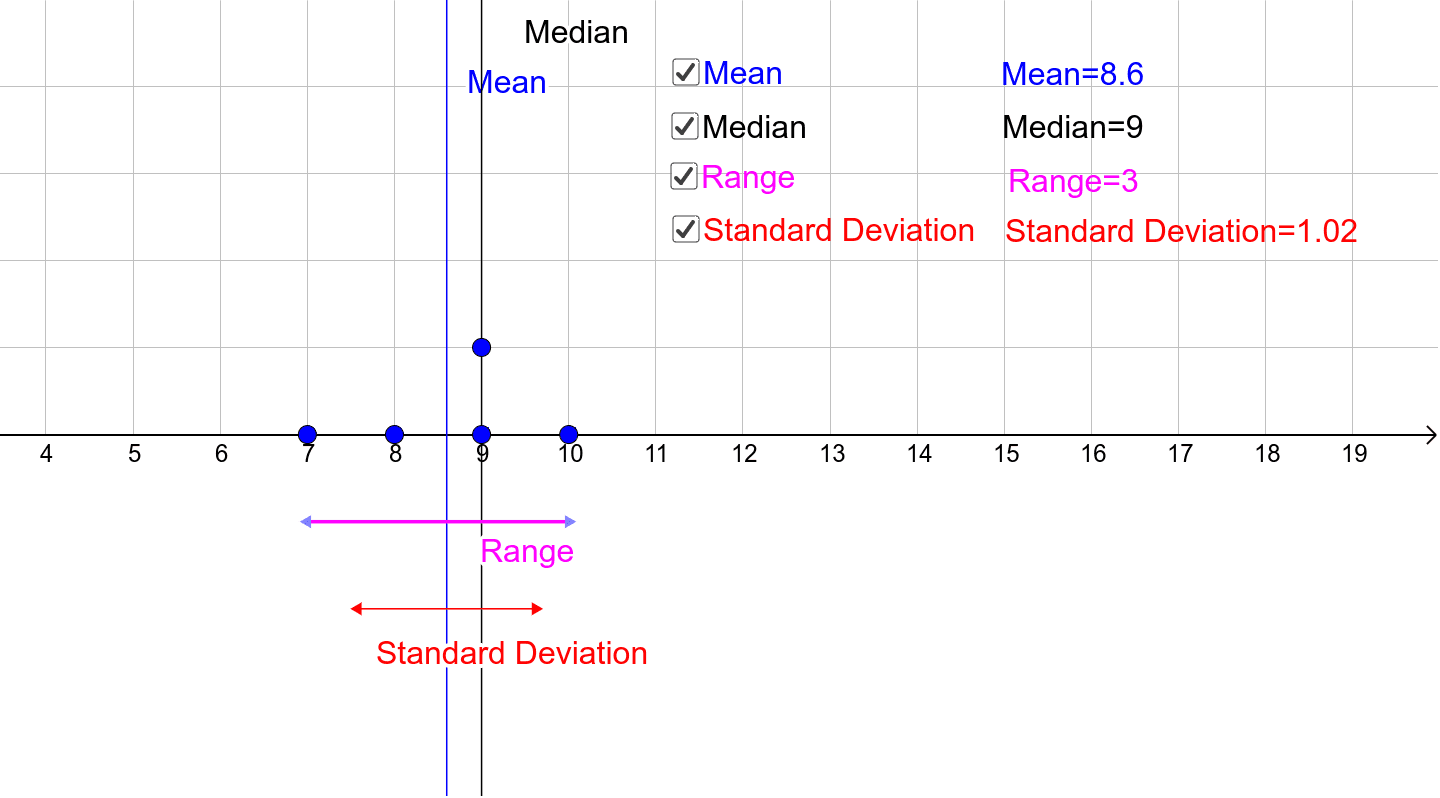
① This GeoGebra example demonstrates statistical analysis of a small data set while simultaneously presenting a kite-shaped geometric construction and related parametric curves. ② Core mathematical concepts include descriptive statistics (mean, median, maximum, minimum, standard deviation), coordinate points, parametric curves, and geometric figures such as a kite and hyperbola. ③ Construction highlights: from the summary, commands like Mean, Median, Max, Min, SD are used to compute central tendency and dispersion; Segment and Point create geometric objects (points A, B, C, D, E and derived points A1-A5, B1-B3); parametric curves and hyperbola are drawn; text objects (text1-text4) display statistical results. ④ Suitable for middle/high school lessons integrating statistics with geometry, helping students visualize statistical measures within a geometric context and understand the interplay between parametric curves and geometric constructions.
GeoGebra Commands & Parameters
Mean(A1:A5) → B1Median(A1:A5) → B2Max(A1:A5) → B7Min(A1:A5) → B8Segment((B7, -1), (B8, -1)) → hSD(A1:A5) → B3Segment((B1 - B3, -2), (B1 + B3, -2)) → iPoint(i) → FPoint(i) → HPoint(h) → GPoint(h) → I
AI Drawing Prompt Reference
Create a combined statistical and geometric diagram. Place five data points on a coordinate planecars. Compute their mean, median, maximum, and minimum. Draw a horizontal segment spanning from the minimum to the maximum, and another horizontal segment spanning from the mean minus standard deviation to the mean plus standard deviation. Place two points on each of these segmentscars. Connect these four points to form a kite-shaped quadrilateral. Additionally, draw a parametric curve and a hyperbola that relate to the kite, serving as background or auxiliary elements. Finally, include text labels displaying the values of the mean, median, maximum, minimum, and standard deviation. The layout should clearly show how the statistical measures relate to the geometric construction.
The prompt above was compiled from the original drawing commands and is for reference only.