
Statistics: Large Data Set (20)
Loading the math board and drawing, please wait…
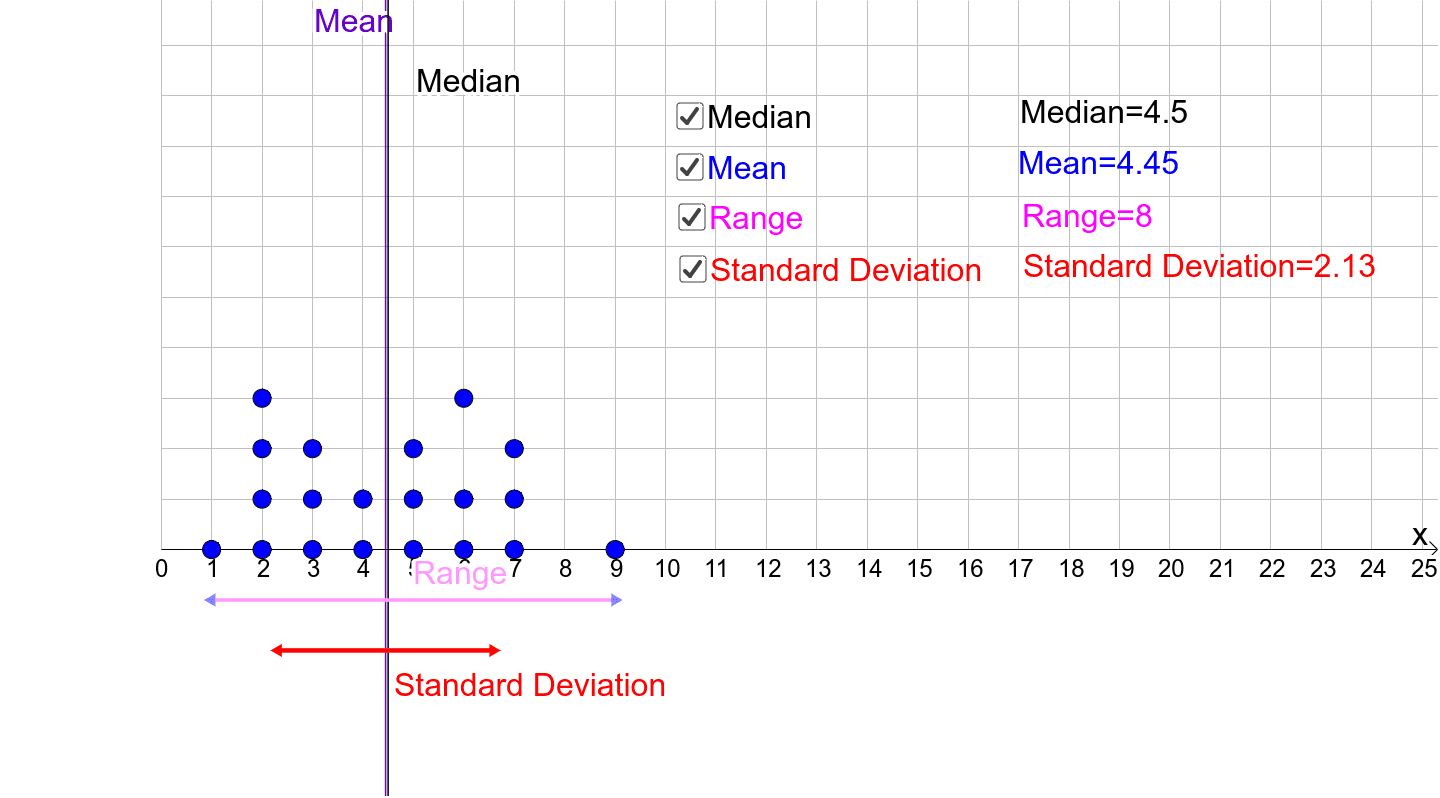
This example demonstrates how to process and analyze a large dataset (20 data points) using GeoGebra. Core math concepts include mean, mode, median, max, min, standard deviation, linear regression, continuity, LCM and GCD, and pie charts or circle charts. Construction highlights involve commands/objects like Mean, Mode, Median, Max, Min, SD, Segment, Point as listed. Suitable for high school and above learners for understanding data statistics and visualization.
GeoGebra Commands & Parameters
Mean(A1:A20) → A21Mode(A1:A20) → A22Median(A1:A20) → A23Max(A1:A20) → A25Min(A1:A20) → A26SD(A1:A20) → B22Segment((A25, -1), (A26, -1)) → gSD(A1:A20) → A24Segment((A21 - B22, -2), (A21 + B22, -2)) → hPoint(g) → UPoint(g) → VPoint(h) → WPoint(h) → Z