
Statistics on Rainy Days in Singapore (1982-2019)
Loading the math board and drawing, please wait…
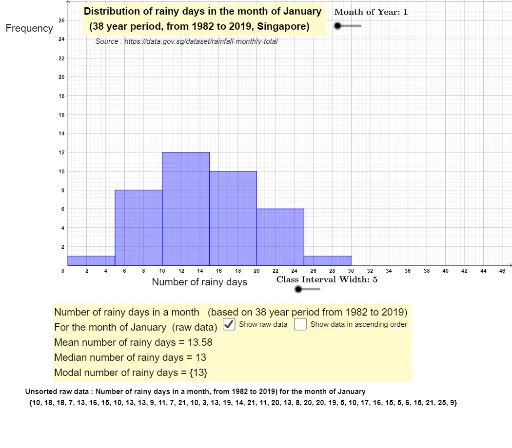
This example demonstrates the statistical distribution of the number of rainy days in each month from 1982 to 2019 in Singapore, presented as a histogram. Core math concepts include probability & statistics, percentage comparison, and data analysis. Construction highlights GeoGebra commands like Length, Sequence, Max, Element, and Histogram. Suitable for high school mathematics education, focusing on data analysis and statistical graphing.
GeoGebra Commands & Parameters
Length(l1) → aSequence(Element[l1, i], i, 1, (b * 12), 12) → rainydaysJanSequence(Element[l1, i], i, 2, (b * 12), 12) → rainydaysFebMax(rainydaysJan) → maxJanLength(rainydaysJan) → cSequence(Element[l1, i], i, 3, (b * 12), 12) → rainydaysMarSequence(Element[l1, i], i, 4, (b * 12), 12) → rainydaysAprSequence(Element[l1, i], i, 5, (b * 12), 12) → rainydaysMaySequence(Element[l1, i], i, 6, (b * 12), 12) → rainydaysJunSequence(Element[l1, i], i, 7, (b * 12), 12) → rainydaysJulSequence(Element[l1, i], i, 8, (b * 12), 12) → rainydaysAugSequence(Element[l1, i], i, 9, (b * 12), 12) → rainydaysSepSequence(Element[l1, i], i, 10, (b * 12), 12) → rainydaysOctSequence(Element[l1, i], i, 11, (b * 12), 12) → rainydaysNovSequence(Element[l1, i], i, 12, (b * 12), 12) → rainydaysDecElement(listsortedraindaysbymonth, 1) → listtextSequence(i, i, 0, 30, width) → listIntervalsHistogram(listIntervals, Element[listsortedraindaysbymonth, f], false) → histogramRainyDaysInMonth
AI Drawing Prompt Reference
Create a histogram showing the statistical distribution of rainy days per month in Singapore from 1982 to 2019. The data is grouped into 12 sets, one for each month, containing the rainy day counts for all years. The x-axis represents intervals of rainy day counts, and the y-axis represents frequency. Each interval is shown as a rectangular bar whose height corresponds to the number of months falling into that interval. The graph should clearly display the central tendency and spread of rainy days for each month, facilitating comparison of rainfall patterns across months.
The prompt above was compiled from the original drawing commands and is for reference only.