
Statistical Calculation Practice
Loading the math board and drawing, please wait…
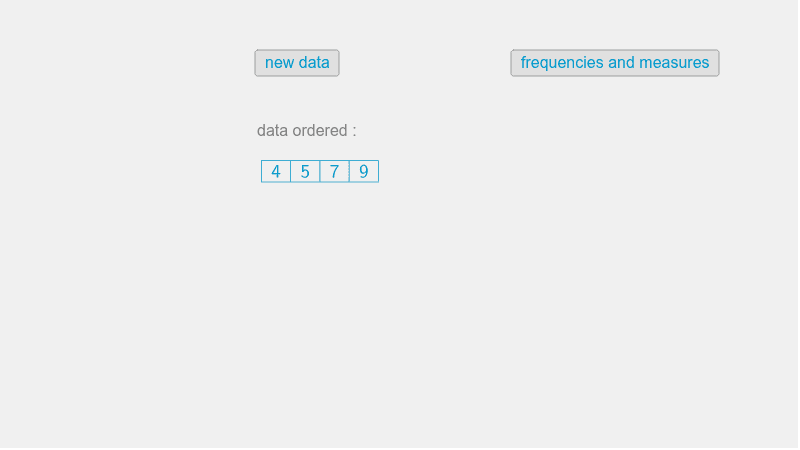
This example demonstrates how to use GeoGebra for practicing statistical calculations. It involves core mathematical concepts such as mean, median, mode, standard deviation, and others. The construction utilizes commands and objects like Sequence, Random, Sort, Mean, Median, Min, Max, Q1, Q3, DotPlot, SD, Mode, Sum, TableText. It is suitable for high school or early university students learning probability and statistics.
GeoGebra Commands & Parameters
Sequence(Random[3, 10] * a - a, a, 1, 10) → DataRandom(4, 10) → lenSequence(Random[3, 10] + a - a, a, 1, len) → LLSort(Data) → SLMean(LL) → MenMedian(LL) → MedMin(LL) → MnMax(LL) → MxQ1(LL) → Q1Q3(LL) → Q3DotPlot(SL) → list1SD(LL) → StDMode(LL) → MdSum(Data) → sTableText({Sort[LL]}, "c|_") → text18FrequencyTable(LL) → text12
AI Drawing Prompt Reference
Create a dot plot using randomly generated data, showing the mean, median, mode, minimum, maximum, first quartile, and third quartile. Generate the data through sequences, sort it, and plot it as dots. Also, display the sorted data and its frequency distribution in a table.
The prompt above was compiled from the original drawing commands and is for reference only.