
Standard Normal Curve by Terry Lee Lindenmuth
Loading the math board and drawing, please wait…
In collections
Rate & Accumulation Yr 4 Much&Fast
Probability & Intro. to Stat.
Math Year 4 Unit Probability & Statistics
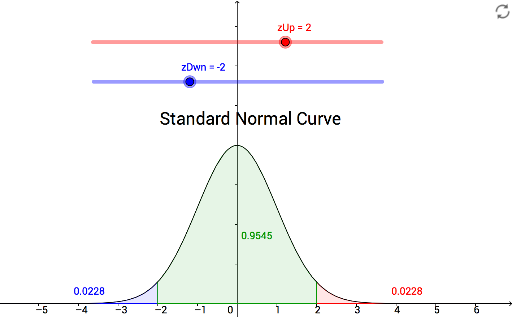
This example demonstrates the construction and calculation of the standard normal distribution curve. Key math concepts include normal distribution, integral calculation, and function graphing. It uses GeoGebra commands like Normal and Integral, with objects such as zUp, zDwn, a, b, c, and text1 for displaying results. Suitable for high school students and users needing to understand basic probability & statistics.
GeoGebra Commands & Parameters
Normal(0, 1, x) → fIntegral(f, zUp, 6) → aIntegral(f, -6, zDwn) → bIntegral(f, zDwn, zUp) → c
AI Drawing Prompt Reference
Draw a standard normal distribution curve and calculate the integrals from -6 to zDwn, from zUp to 6, and from zDwn to zUp, showing these areas in different colors or shading, while labeling the total integral area and the results of each part, demonstrating the symmetry of the normal distribution and the integral calculation process.
The prompt above was compiled from the original drawing commands and is for reference only.