
Distribution of Order Statistics
Loading the math board and drawing, please wait…
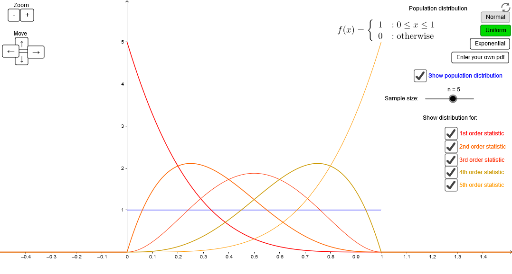
This example demonstrates the distribution of order statistics for a sample of size n drawn from an arbitrary population distribution. Key mathematical concepts involved include probability & statistics, distribution functions, and integral calculations. The construction leverages GeoGebra commands like Integral, Textfield, f, Foffset, Ftemp, c_1, showPopDist, buttonNormal, show1, odistLabel, show2, buttonUniform, buttonExp, show3, show4, show5, show6, show7, show8, n, F, f1, f2, f3, f4, f5, f6, f7, f8, fDisplay, buttonGeneric, showfInput, inputBox1, selected, buttonExpOn, buttonGenericOn, buttonUniformOn, buttonNormalOn, zoomLabel, zoomIn, zoomOut, moveLabel. It is suitable for high school students and above, as well as university-level teaching demonstrations.
GeoGebra Commands & Parameters
Integral(f, -10, 0) → FoffsetIntegral(f) → FtempTextfield(f) → inputBox1
AI Drawing Prompt Reference
Draw a graph showing the distribution of order statistics for a sample size n from an arbitrary population distribution, including a probability density function curve, an integral area from -10 to 0 labeled Foffset, another integral from negative infinity to positive infinity labeled Ftemp, and a text box inputBox1 displaying the function f, all demonstrating the calculation process of probability, functions, and integrals.
The prompt above was compiled from the original drawing commands and is for reference only.