
Step Functions Example 1: Constructing a Piecewise Function
Loading the math board and drawing, please wait…
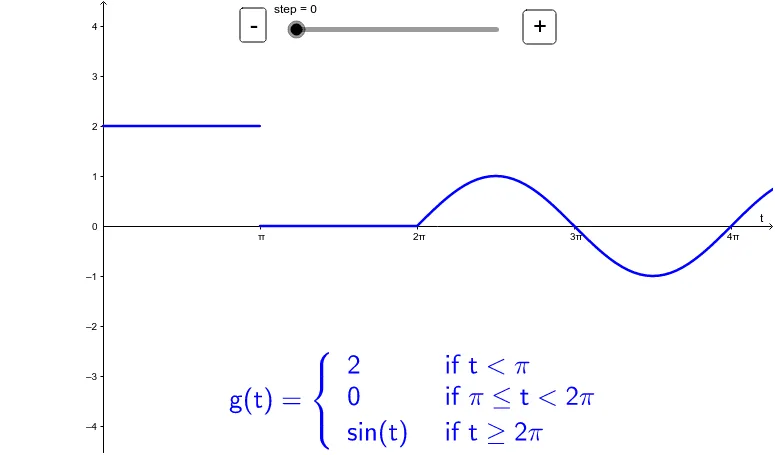
This example demonstrates how to construct a piecewise-defined function step by step using step functions (unit step functions). It visually shows how combining step functions can build a more complex piecewise function, and also explores statistical characteristics such as means. Core mathematical concepts include piecewise functions, step functions, function graphing, statistical measures, and curve sketching. The construction uses GeoGebra objects such as g1, u1, u11, g2, u2, h1, h2, and buttons (button1, button2) to control the step-by-step process, with text objects (text1-text10) providing explanations. This is suitable for high school or early college students learning function definitions, piecewise construction, and statistical features, and can be used for classroom demonstrations or self-study.
GeoGebra Commands & Parameters
g1(x) = If[x > 0, 2]u1(x) = If[x > π, 1, If[x > 0, 0]]u11(x) = (-2 * u1(x))g2(x) = g1(x) + u11(x)u2(x) = If[x > (2 * π), 1, If[x > 0, 0]]h1(x) = If[x > 0, sin(x)]h2(x) = (u2(x) * h1(x))g(x) = g2(x) + h2(x)Numeric step(0)g1u11g2u2h1
AI Drawing Prompt Reference
Draw a step-by-step construction of a piecewise function. Start with a horizontal line at height 2 for x greater than 0. Then introduce a unit step function that is 1 for x greater than π and 0 otherwise, multiply it by -2, and add it to the initial line, making the function drop to 0 for x greater than π. Next, add another step function that is 1 for x greater than 2π and 0 otherwise, multiply it by the sine function, and add this to the current graph, so that for x greater than 2π the sine wave appears. Show the final piecewise function with step-by-step control buttons and explanatory text.
The prompt above was compiled from the original drawing commands and is for reference only.