
Standard Deviation and Continuity
Loading the math board and drawing, please wait…
In collections
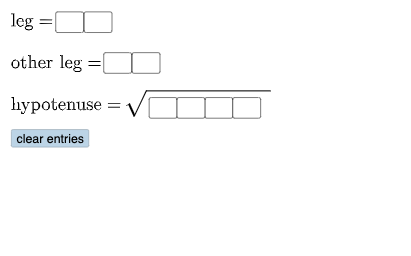
Open Middle: Pythagorean Theorem (3)
This example illustrates the concepts of standard deviation and continuity. By inputting different values, observe the distribution of data points and changes in standard deviation. It uses commands such as Textfield, Polygon, Segment, Angle, Circle, Point, Mirror, Intersect, Mode, If. Suitable for high school math education and learning.
GeoGebra Commands & Parameters
Textfield(a) → InputBox1Textfield(b) → InputBox2Textfield(c) → InputBox3Textfield(d) → InputBox4Textfield(f) → InputBox5Polygon(A, B, C) → t1, c_1, a_1, b_1Segment(C, B) → h_{1}Segment(B, A) → i_{1}Segment(A, C) → jAngle(C, B, A) → αCircle(D, (10 * a) + b) → ePoint(e) → ECircle(E, c) → kSegment(D, E) → lMirror(E, l) → E'Mirror(D, l) → D'Mirror(E, l) → E'_{1}Mirror(D, l) → D'_{1}Circle(D, sqrt((100 * d) + (10 * f) + g_{1})) → qIntersect(k, q, 2) → FSegment(D, F) → mSegment(F, E) → nAngle(F, E, D) → βTextfield(h) → InputBox8Textfield(g) → InputBox6Textfield(i) → InputBox7Circle(D, (10 * a) + b) → pPoint(p) → HSegment(D, H) → rCircle(H, (10 * c) + d) → sIntersect(p, s, 1) → ICircle(D, sqrt((1000 * f) + (100 * g) + (10 * h) + i)) → d_1Intersect(s, d_1, 2) → JSegment(H, J) → f_1Segment(D, J) → tAngle(J, H, D) → γPolygon(D, H, J) → t2, j_1, d_2, h_2Mode(l2) → l1If(Length[l1] ≟ 0, "No digits repeat.", "You have repeated digits.") → text4
AI Drawing Prompt Reference
Create a visual to illustrate standard deviation and continuity. Input four values a, b, c, d to generate a polygon ABC and its sides. Draw a circle D centered at B with radius (10a+b), and another circle k centered at E with radius c. Perform mirror operations to create points E', D', E'1, D'1, and connect them with segments. Finally, draw a circle q centered at D with radius sqrt((100d+10f+g1)), intersect it with circle k at point F, and connect D to F and F to E, labeling the angles involved to show data distribution and standard deviation changes.
The prompt above was compiled from the original drawing commands and is for reference only.