
Stable/Unstable Equilibrium Solutions Visualization
Loading the math board and drawing, please wait…
In collections
MATH1052-edX
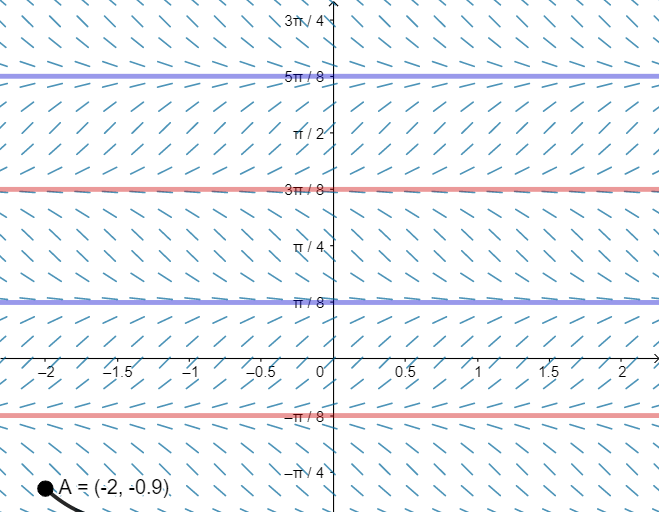
This GeoGebra example demonstrates stable and unstable equilibrium solutions of a first-order differential equation using slope fields and numerical solving. The core mathematical concept is the stability of equilibrium points: a stable equilibrium attracts nearby solution curves, while an unstable one repels them. The construction employs the SlopeField command to render the direction field, and SolveODE to compute particular solutions from initial conditions. Interactive elements include a button (button1) and a slider (a) to adjust parameters, allowing users to observe how the equilibrium position and its stability change. Objects such as A, f, F, Sol1, g, h, i, j define functions, solution curves, and auxiliary graphics. This resource is ideal for university-level differential equations courses or advanced high school mathematics, providing a visual and hands-on approach to understanding equilibrium stability and the use of computational tools in dynamical systems analysis.
GeoGebra Commands & Parameters
SlopeField(f, 25, 0.7) → FSolveODE(f, x(A), y(A), 10, 0.01) → Sol1
AI Drawing Prompt Reference
Create a slope field visualization for a differential equation, showing stable and unstable equilibrium solutions. Use distinct colors for the direction field and plot solution curves starting from specific initial conditions. Adjust a slider to observe how changing parameters affects the position and stability of equilibrium points, with stable points attracting curves and unstable points repelling them.
The prompt above was compiled from the original drawing commands and is for reference only.