
Spline Derivative Grapher: Visualizing Derivatives of Spline Curves
Loading the math board and drawing, please wait…
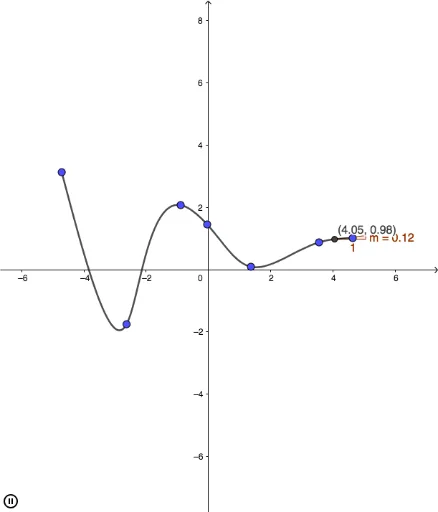
This interactive GeoGebra example demonstrates the geometric meaning of derivatives through spline curves. By manipulating control points or parameters, users can observe how the spline shape changes and simultaneously see the tangent line and slope at a selected point, along with the derivative graph. Core mathematical concepts include spline interpolation, derivatives, continuity, and tangent slopes. The construction uses GeoGebra commands such as Spline to generate the curve, Tangent to draw the tangent line at a point, and Slope to compute its gradient. Key objects include control points A, B, C, D, E, H, I, parameter n, functions f and F, slope value m, and a button (button1) for interactive control. This resource is suitable for high school to university-level calculus instruction, particularly for teaching the geometric interpretation of derivatives, properties of spline functions, and numerical differentiation visualization. It also supports mathematical experimentation and inquiry-based learning.
GeoGebra Commands & Parameters
Spline({A, B, C, D, E, H, I}, 3) → aTangent(F, a) → fSlope(f) → m
AI Drawing Prompt Reference
Draw a cubic spline curve through multiple control points and display its derivative graph. Select a point on the curve, draw the tangent line at that point, and show the slope value. Adjust a slider to observe how changes in the parameter affect the curve shape, the tangent line, the slope, and the derivative graph.
The prompt above was compiled from the original drawing commands and is for reference only.