
Sphere and Step Functions: Dynamic Sequence and Circle Interaction
Loading the math board and drawing, please wait…
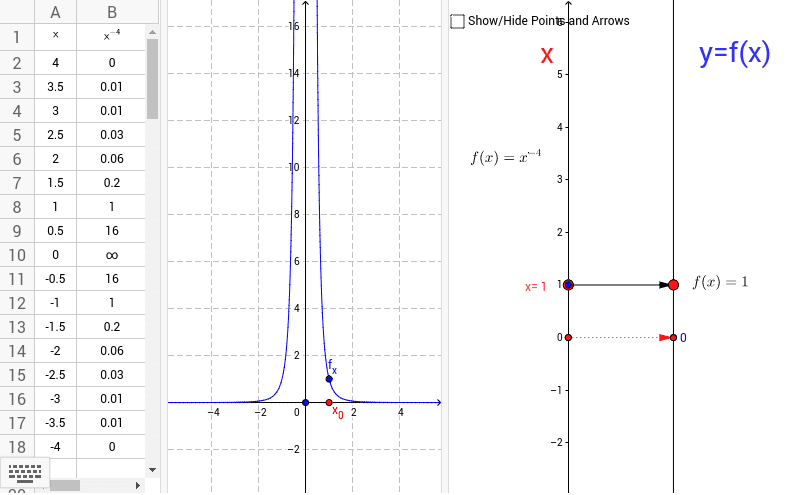
This GeoGebra example demonstrates a dynamic mathematical visualization combining a sphere, step functions, sequences, and circles, illustrating the interplay between discrete sequences and continuous geometric objects. Core mathematical concepts include sequence recursion and summation, step function graphs, circle equations, and spherical representation in 3D space. The construction uses commands such as Point, Vector, Textfield, and Sequence to create dynamic point sets and input boxes, with sliders and text controls to adjust parameters. A list (list1) and multiple auxiliary points (A1–A10, B1–B10) generate step-like graphs, while circle and sphere equations reveal geometric relationships. This resource is suitable for high school or early college students to explore sequence limits, function approximation, and the integration of algebra and geometry, and can serve as material for math labs or inquiry-based learning.
GeoGebra Commands & Parameters
Point(yAxis) → AVector(A, B) → uTextfield(f) → inputBox1Vector((0, 0), (2, 0)) → vVector(H, I) → wVector(J, K) → zSequence(Vector[(0, i), (2, f(i))], i, -4, 4, 0.5) → list2Sequence((i, f(i)), i, -4, 4, 0.5) → list3
AI Drawing Prompt Reference
Draw a sphere and a series of step function graphs defined by input box f, with x-coordinates ranging from -4 to 4 and a step size of 0.5. Also, plot a series of points with x-coordinates from -4 to 4 and y-coordinates given by f(x), with the same step size. Finally, draw a vector u from point A to point B, and two vectors v and w, both starting from the origin and pointing to (2,0) and from H to I respectively.
The prompt above was compiled from the original drawing commands and is for reference only.