
Solving Quadratic Inequalities with Visual Demonstration
Loading the math board and drawing, please wait…
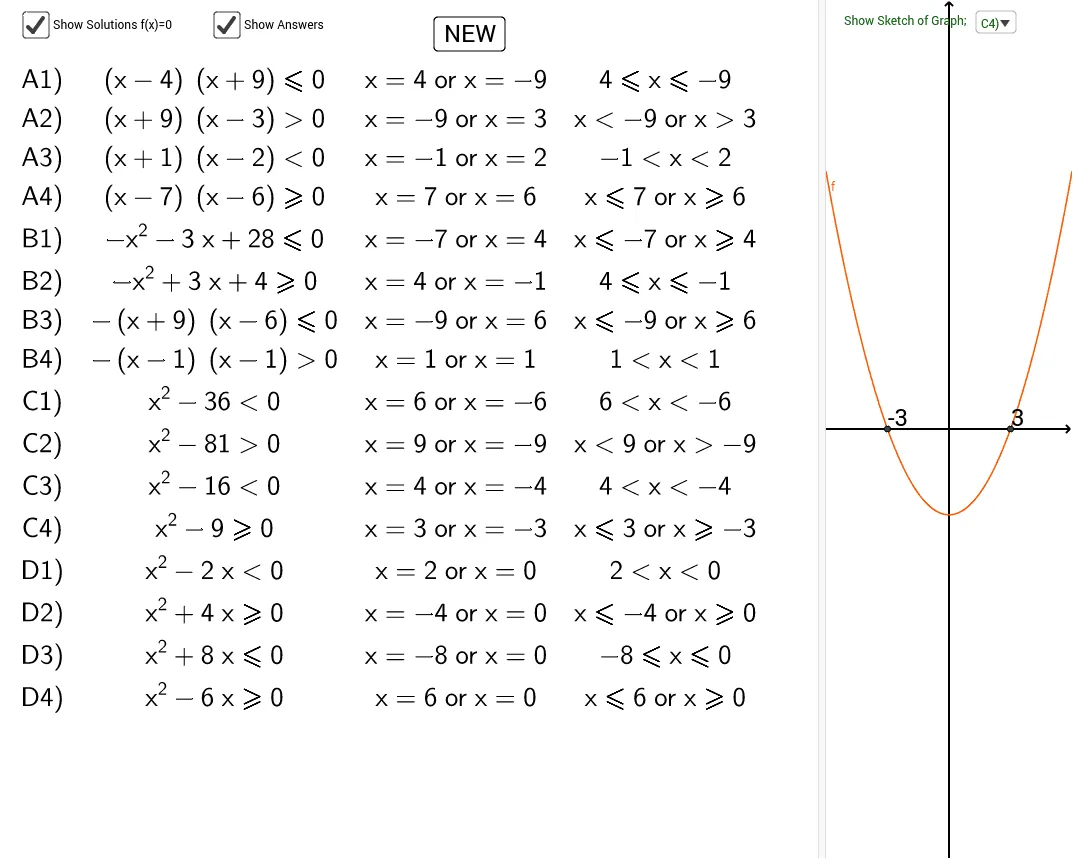
This GeoGebra example dynamically demonstrates the solution of quadratic inequalities, visually linking the parabola graph to the inequality solution set. Core mathematical concepts include quadratic functions, one-variable quadratic inequalities, interval notation, and visualization of solution sets on the number line. Construction highlights: commands such as Join, Sort, Element, Simplify, RandomElement, Remove, If, Intersect, and TableText are used to manage data lists, simplify expressions, generate random coefficients, determine intersection points, and produce result tables. Multiple points (e.g., A12-A15, B12-B15) and lists (list1, list7) are involved to build the dynamic figure. Suitable for high school students learning quadratic functions and inequalities, this example helps bridge algebraic solutions with geometric representations, and is ideal for classroom demonstrations or self-directed exploration.
GeoGebra Commands & Parameters
Join({list1, {"None"}}) → list7Sort(N', Sequence[random(), i, 1, 10]) → N_2Element(N_2, A15) → B15Simplify(((x - B15) * (x - C15))) → D15Element(N_2, A14) → B14Simplify(((x - B14) * (x - C14))) → D14Element(N_2, A13) → B13Simplify(((x - B13) * (x - C13))) → D13Element(N_2, A12) → B12Simplify(((x - B12) * (x - C12))) → D12Join({N', (-N')}) → NRandomElement(N) → B20Simplify(((x - B20) * (x - C20))) → D20RandomElement(N) → B19Simplify(((x - B19) * (x - C19))) → D19RandomElement(N) → B10RandomElement(Remove[N, {(-B10)}]) → C10Simplify(((-(x - B10)) * (x - C10))) → D10RandomElement(N) → B9RandomElement(Remove[N, {(-B9)}]) → C9Simplify(((-(x - B9)) * (x - C9))) → D9RandomElement(N) → B5RandomElement(Remove[N, {B5}]) → C5Simplify(((x - B5) * (x - C5))) → D5RandomElement(N) → B18Simplify(((x - B18) * (x - C18))) → D18RandomElement(N) → B17Simplify(((x - B17) * (x - C17))) → D17RandomElement(N) → B8RandomElement(Remove[N, {(-B8)}]) → C8Simplify(((-(x - B8)) * (x - C8))) → D8RandomElement(N) → B7RandomElement(Remove[N, {(-B7)}]) → C7Simplify(((-(x - B7)) * (x - C7))) → D7RandomElement(N) → B2RandomElement(Remove[N, {B2}]) → C2Simplify(((x - B2) * (x - C2))) → D2RandomElement(N) → B3RandomElement(Remove[N, {B3}]) → C3Simplify(((x - B3) * (x - C3))) → D3RandomElement(N) → B4RandomElement(Remove[N, {B4}]) → C4Simplify(((x - B4) * (x - C4))) → D4RandomElement(T_1) → E2RandomElement(T_2) → E3RandomElement(T_1) → E7RandomElement(T_2) → E8RandomElement(T_1) → E12RandomElement(T_2) → E13RandomElement(T_1) → E17RandomElement(T_2) → E18Remove(N, {-5}) → list2RandomElement(T_1) → E4RandomElement(T_2) → E5RandomElement(T_1) → E9RandomElement(T_2) → E10RandomElement(T_1) → E14RandomElement(T_2) → E15RandomElement(T_1) → E19RandomElement(T_2) → E20If(E2 ≟ "lt", H2, If[E2 ≟ "gt", I2, If[E2 ≟ "leqslant", J2, K2]]) → L2If(E3 ≟ "lt", H3, If[E3 ≟ "gt", I3, If[E3 ≟ "leqslant", J3, K3]]) → L3If(E4 ≟ "lt", H4, If[E4 ≟ "gt", I4, If[E4 ≟ "leqslant", J4, K4]]) → L4If(E5 ≟ "lt", H5, If[E5 ≟ "gt", I5, If[E5 ≟ "leqslant", J5, K5]]) → L5If(E7 ≟ "lt", H7, If[E7 ≟ "gt", I7, If[E7 ≟ "leqslant", J7, K7]]) → L7If(E8 ≟ "lt", H8, If[E8 ≟ "gt", I8, If[E8 ≟ "leqslant", J8, K8]]) → L8If(E9 ≟ "lt", H9, If[E9 ≟ "gt", I9, If[E9 ≟ "leqslant", J9, K9]]) → L9If(E10 ≟ "lt", H10, If[E10 ≟ "gt", I10, If[E10 ≟ "leqslant", J10, K10]]) → L10If(E12 ≟ "lt", H12, If[E12 ≟ "gt", I12, If[E12 ≟ "leqslant", J12, K12]]) → L12If(E13 ≟ "lt", H13, If[E13 ≟ "gt", I13, If[E13 ≟ "leqslant", J13, K13]]) → L13If(E14 ≟ "lt", H14, If[E14 ≟ "gt", I14, If[E14 ≟ "leqslant", J14, K14]]) → L14If(E15 ≟ "lt", H15, If[E15 ≟ "gt", I15, If[E15 ≟ "leqslant", J15, K15]]) → L15If(E17 ≟ "lt", H17, If[E17 ≟ "gt", I17, If[E17 ≟ "leqslant", J17, K17]]) → L17If(E18 ≟ "lt", H18, If[E18 ≟ "gt", I18, If[E18 ≟ "leqslant", J18, K18]]) → L18If(E19 ≟ "lt", H19, If[E19 ≟ "gt", I19, If[E19 ≟ "leqslant", J19, K19]]) → L19If(E20 ≟ "lt", H20, If[E20 ≟ "gt", I20, If[E20 ≟ "leqslant", J20, K20]]) → L20If(a, L2, "?") → E23If(a, L3, "?") → E24If(a, L4, "?") → E25If(a, L5, "?") → E26If(a, L7, "?") → E28If(a, L8, "?") → E29If(a, L9, "?") → E30If(a, L10, "?") → E31If(a, L12, "?") → E33If(a, L13, "?") → E34If(a, L14, "?") → E35If(a, L15, "?") → E36If(a, L17, "?") → E38If(a, L18, "?") → E39If(a, L19, "?") → E40If(a, L20, "?") → E41Element(list5, SelectedIndex[list7]) → fIntersect(f, xAxis) → A, BTableText({list1, list3, If[d, list6, {}], list4}, "cv") → text2
AI Drawing Prompt Reference
Create a coordinate system showing multiple parabolas, each defined by two randomly chosen real rootsasi. Some parabolas open upward and some downward to illustrate different quadratic inequalities. On the number line, highlight the solution intervals for each inequality in distinct colors, with interval endpoints aligned to the parabola roots. Include a results table listing each inequality and its solution set. Ensure roots are unique across functions, with some functions constructed using opposite roots for symmetry. The overall layout should clearly connect each parabola's graph to its corresponding solution interval on the number line.
The prompt above was compiled from the original drawing commands and is for reference only.