
Solving Quadratic Equations Graphically
Loading the math board and drawing, please wait…
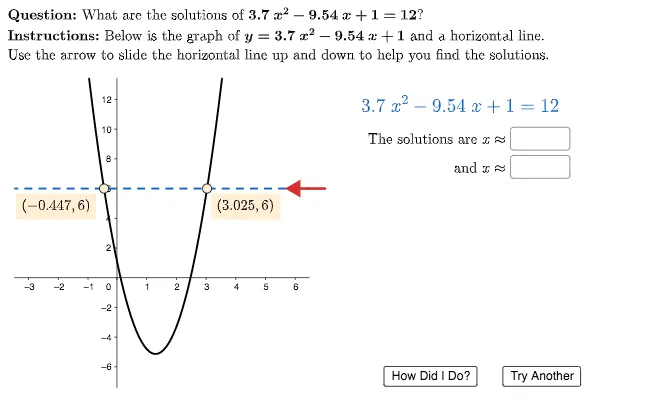
This example demonstrates solving quadratic equations using graphical methods. Key math concepts include quadratic function graphs, vertex, axis of symmetry, and roots. GeoGebra commands and objects used in construction are Random, Solutions, Zip, Textfield, Polygon, UnicodeToLetter, Sequence, Point, Segment, Intersect. Suitable for high school mathematics teaching to help students visually understand the relationship between solutions of quadratic equations and function graphs.
GeoGebra Commands & Parameters
Random(-5, 13) → kSolutions(expression = k) → actualSolutionsZip(round(A, 3), A, actualSolutions) → actualRoundedSolutionsTextfield(textSol1) → inputBox1Textfield(textSol2) → inputBox2Polygon({(-3.5, -7.5), (-3.5, 13.5), (6.5, 13.5), (6.5, -7.5)}) → backgroundUnicodeToLetter(10003) → cmarkUnicodeToLetter(10007) → xmarkSequence((6, i), i, -5, 13) → allowableDragPointsPoint(allowableDragPoints) → dragPointSegment(dragPoint, dragPoint + (1, 0)) → arrowLineIntersect(expression, horLineFree) → A, B
AI Drawing Prompt Reference
Draw a quadratic function graph on a rectangular background with a vertex and axis of symmetry. Mark the roots on the x-axis, distinguishing actual and approximate solutions with different symbols. Include input boxes for manual verification of solutions, visually demonstrating the graphical method for solving quadratic equations.
The prompt above was compiled from the original drawing commands and is for reference only.