
Solving Quadratic Equations: Discriminant, Roots, and Graph Visualization
Loading the math board and drawing, please wait…
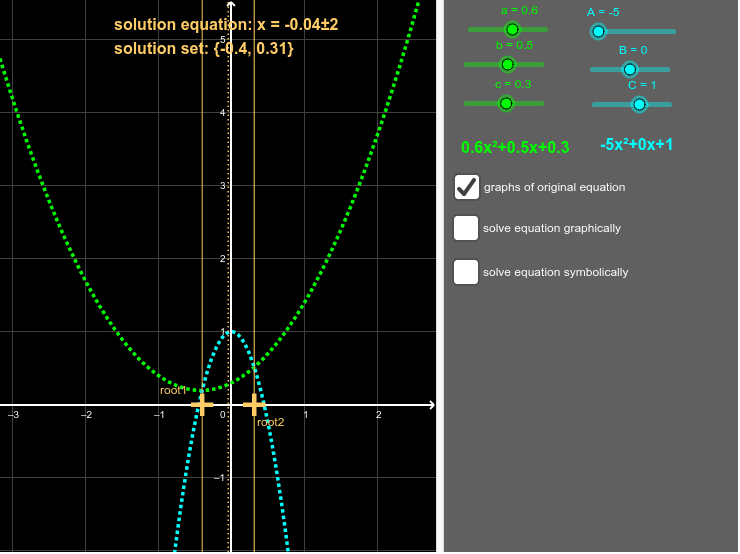
① This GeoGebra example dynamically demonstrates the process of solving a quadratic equation ax²+bx+c=0, closely linking algebraic solutions with the parabolic graph and showing how the discriminant affects the nature of the roots. ② Core mathematical concepts include quadratic equations, the discriminant, the quadratic formula, the axis of symmetry and vertex of a parabola, and the correspondence between roots and x-intercepts of the graph. ③ Construction highlights: using the Polynomial command to define the quadratic function, OrthogonalLine and Point to create auxiliary geometric elements, with sliders or objects a, b, c as adjustable parameters; it computes the discriminant disc and roots root1 and root2, and generates multiple text objects (text1 to text9) to dynamically display the equation and solutions, along with coefficient objects (constant, linear, quad), a scale factor, and auxiliary points F, G, D, E, H, I. ④ Suitable for middle and high school mathematics (grades 8–12) to study the relationship between quadratic equations and their graphs, and for teachers to use in classroom demonstrations or for students to explore how changing parameters affects the roots.
GeoGebra Commands & Parameters
OrthogonalLine(F, xAxis) → dOrthogonalLine(G, xAxis) → ePoint(e) → DPoint(yAxis) → EPoint(d) → HPoint(yAxis) → IPolynomial({D, E, H}) → gPolynomial({D, I, H}) → q
AI Drawing Prompt Reference
Draw a dynamic quadratic function graph illustrating the solution of ax²+bx+c=0. The graph shows a parabola defined by adjustable parameters a, b, and c. Two vertical auxiliary lines are drawn perpendicular to the x-axis, passing through symmetric points on the parabola, with marked points at their intersections. Additionally, two points are placed on the y-axis, and curves are constructed through these points and the auxiliary-line points to help visualize the relationship between roots and x-intercepts. The display includes the discriminant value, the two root expressions, and the equation itself, all updating in real time as parameters change. The layout is clear, allowing observation of how parameter variations affect the roots and the graph.
The prompt above was compiled from the original drawing commands and is for reference only.