
Solving Quadratic Equations by loreang98
Loading the math board and drawing, please wait…
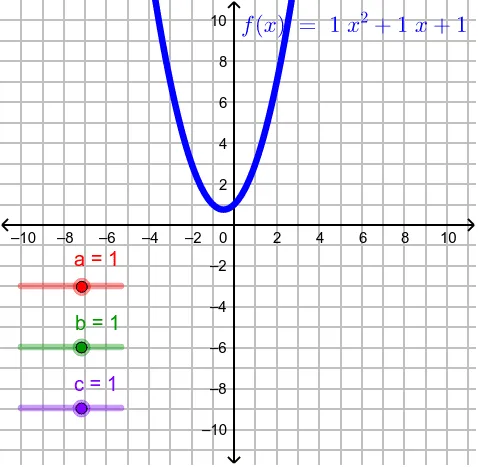
This example demonstrates solving quadratic equations using GeoGebra and visualizing their graphs. Key mathematical concepts include quadratic functions, discriminant analysis, and parabola properties. Construction involves using the Intersect command to determine intersection points, and objects a, b, c, f, A, B for parameterization. Suitable for high school students learning quadratic function properties and coordinate geometry applications.
GeoGebra Commands & Parameters
Intersect(f, xAxis, 1) → AIntersect(f, xAxis, 2) → B
AI Drawing Prompt Reference
Draw a parabola graph to illustrate quadratic function properties. The parabola should intersect the x-axis at two points, labeled A and B. The graph should clearly show the direction of the parabola and its axis of symmetry. Keep the graph simple to help understand basic quadratic concepts.
The prompt above was compiled from the original drawing commands and is for reference only.